10 errors to avoid when starting as a translator

By Nicolas Gambardella

Many people start in the translation business without a corresponding professional training. This is absolutely fine, and it is in fact a good way of using one’s language skills acquired either during a professional activity or a travelling life. However, as amateurs, they probably all tend to make the same mistakes. Here we list a few of them.

1) Believing that a translation job is just … translating

A translation job is much more than converting a text from a source language to a target language. Glossaries and a bit of grammar polishing would almost be sufficient for that. However, a translator must convey the “content” of the source document. That involves of course translating the words. But it also, and foremost, involves producing a text that carries the same message. And to do so requires to understand what the text is about, in details and with all its subtleties. This is why all translators have their specialities, and although most translators can do an OK job with any text in their paired languages, they really excel only within a few niches.

Conveying the proper meaning is sometimes at odd with keeping to a strict translation of the words themselves. Depending on the domain covered, one wants to massage the text to make it more readable and respect the form of the source text. With the exception of legal documents – where one must absolutely stick to the original, even if the result seems quite heavy – some sentence restructuring and expression switching is needed to make the result more palatable, and also truly equivalent in the target language. Finally, in the artistic domain, one wants to respect the style of the original, terse or verbose, dull or vivid, mainstream or abstruse. Lovecraft did not write like Stephen King despite hovering in the same literature space.

2) Starting the translation immediately

In order to translate a text accurately, we cannot start the work straight away. We must read the entire text beforehand, to make sure we understand what it is about, have an idea of the specialized knowledge we might need to acquire, and what was the goal of the authors. Such a preliminary read will only marginally increase the time spent on a text. Or at least it should, otherwise we are probably not spending enough time on the job! Reading a 100 000 words book before starting the translation might seem daunting, but the required time is still far less than what we will spend accurately translating those 100 000 words. And the gain down the line in terms of translation speed and accuracy largely makes up for the extra effort. During this initial read, we should make notes of anything we do not immediately get, any word or expression we did not come across in the past, and make sure we do fully understand it.

3) Trusting machine translation

Machine translation has seen astounding progress in the past few years. Software such as the Google Neural Machine Translation and (even more) DeepL , really transformed the activity to a point that, in many cases, the result really sounds like it has been produced by a native speaker, but is also better than a translation made by a casual translator, i.e. someone who would make most of the errors listed here … (By the way, this makes even more pathetic the ridiculous translations used in some places such as Stansted airport. It beggars belief that nowadays people produced voice announcements that barely make sense, and even check-in machines that speak some nonsense languages using random words assembled in sentences with no grammar whatsoever).

However, machine translation is still mostly good for straight texts, without nuance, technical jargon, and stylistic oddities. It is still too much based on word for word translation, or translation of short segments. This often results in wrong choices in case of homonyms in the source language, wrong split of propositions in long sentences, lots of repetitions etc. Also, machines seem to ignore basic life facts, such as only female give birth. So the translation of “They gave birth to their babies” is invariablyIls ont donné naissance à leurs bébés” and not “Elles ont donné naissance à leurs bébés”. More disturbingly, when we want to translate “he ate his date”, instead of “il a mangé sa date”, Google Translate provides “Il a mangé son rendez-vous” and DeepL even decides to add up slang to the delightful “Il a mangé son rencard“. Not very vegan.

That said, machine translation is generally a good feeder for Computer Assisted Translation, which brings us to the next mistake.

4) Blindly trusting the segment-based text proposed by our CAT software

Computer Assisted Translation speeds up translation massively. It saves all the time spent translating and typing trivial pieces of text such as “the red car”, “his name was Joe” and “the sky was gray and it was likely to rain”. However, CAT cannot be trusted blindly. CAT translation is based on segmentation. The text is split in small parts, containing one or a few sentences. The software then suggest translations for each segment.

Firstly, some of those translations might come from machine translation, e.g. Google Translate or DeepL. Thus, see point 3. But very often the translations come from Translation Memories. Translation memories come with their own problems. Sometimes the translations proposed are plainly wrong, with missing words or wrong sentence parsing (resulting in wrong adjective associations for adjectives or verbs for instance). Another important issue is error propagation. If a segment was badly translated once, and this translation was recorded in TMs, it will be proposed in future translations.

A very important issue is the fact that the translations proposed for a segment is done purely on this segment, independently of the content of other segments of the text. There is rarely enough context in a single segment to discriminate between different meanings of a term.

Finally, the segmentation largely follows the punctuation in the source language. Depending on the translation, for instance in literary works where one needs to keep a style and rhythm, the optimal split might be different in the target language. Fortunately, CAT tools offer segment split/merge facilities.

5) Assuming the source document is right

This is a thorny issue. The basic position is that the source language document is correct, and we need to faithfully translate it. But this is not necessarily the case. Everyone makes mistakes, even the most thorough writers. Some mistakes are easy to spot and to correct, and many should not affect the translation, such as unambiguous spelling errors. However, others will be much harder to detect. For instance, words with similar pronunciations in English (the ubiquitous “complimentary” for “complementary”, “add” for “had”, “your” for “you’re” or the dreadful “of” for “have”), or absence of accents (or incorrect ones) in French, will lead to completely wrong translations. In many case, the context will provide a quick answer, but sometimes a bit more brain juice is needed. We should always double check that we understood the text correctly, and that our chosen translation is the only one.

Finally, horror, some “errors” are made on purpose, for stylistic reasons. In the case of a novel or a play, wrong grammar or vocabulary might be part of the plot or a defining feature of a character. In that case, we probably must provide a translation that contain a correct equivalent of the initial erroneous text …

6) Forgetting to double check the punctuation

OK, that might actually be a specific version of the previous error. Translators are linguists, and as all linguists, we are in love with punctuation (aren’t we?). Is there anything that beats the Oxford comma as a favorite topic for conversation? (except perhaps split infinitives) Surprisingly enough, this is not the case of every person, or even every writer. Punctuation can be a life saver in the case of very long and complex sentences. It can also be a killer in case it is absent, or, heaven forbid, wrongly placed. For instance, observe the following bit of text:
“an off-flavour affecting negatively the positive fruity and floral wine aromas known as Brett character.”

What is the “Brett character”? (enlightened disciples of Bacchus, lower your hand). Is it the positive fruity and floral wine aromas? Or is it the off-flavour? It is, in fact, the latter, a metallic taste given by some yeast (from the genus Brettanomyces). Of course, the answer would be much clearer if the source sentence was:

“an off-flavour affecting negatively the positive fruity and floral wine aromas, known as “Brett character”.”

But let’s not add punctuation to Guillaume Appolinaire’s poetry, and keep Le Pont Mirabeau free of punctuation. Actually, the following translation of La Tour Eiffel might be one of the truest poetry translation ever, respecting the meaning, the style, and the shape.

7) Not paying attention to the mainstream use bias

This error is often a side-effect of using CAT tools with TMs or MT. The proposed translations will often rely on the most frequent meaning of a term, and its most frequent translation. This is not necessarily the meaning which is the right one, or the best one, for the current source document.

Sometimes, this is just irritating. For instance, in a literary text talking about “petits détours”, CAT will keep suggesting “small detours”. While this is correct, it does not fully convey the idea carried by “petits” here. It is too bland too quantitative, and “little detours” is the best translation, as shown here, here and here.

However, the mistake can be more severe. Google Translate tells us the story of a dreadful mum, “She put a bow in her daughter’s hair” being translated into “Elle a mis un arc dans les cheveux de sa fille”. That must have hurt terribly. As was the case for the poor lad who “entered a ball” and ended up “entré dans un ballon” (GT) or even “entré dans une balle” (DeepL), instead of “entré dans un bal”. Not much room to dance there. Sometimes, the mainstream use is actually overridden by the politically correct one, and the saucy “he was nibbling at her tit” is translated into “il mordillait sa mésange”. Except if we are talking about a cat, that is a disturbing image instead of a titillating one. While those examples were a bit joky, some cases are harder to spot. Someone who planted “Indian flags” in their garden will almost always end up in French exhibiting their nationalism rather than their love of irises.

In some cases, the various meanings have similar frequencies in daily use, and different tools provide alternative suggestions. DeepL will suits plumbers providing “installer un compteur” for “To set up a counter”, while Google Translate will lean towards merchants with “mettre en place un comptoir“.

8) Trying to stick 100% to the words of the source text

The true meaning of a word goes beyond its definition in a thesaurus. They carry different weight in different languages. The rude word meaning faeces is used as an interjection in almost every language. However, the level of rudeness is different in all western European countries, and sometimes choosing another rude word of the adequate level is better (no, we will not provide examples). And of course, there are very few cases where anyone should translate “it rains cats and dogs” into “il pleut des chats et des chiens”. One should always translate it into “il pleut comme vache qui pisse” (it rains as if a cow was pissing). While the new image is no so much better, at least no animal is hurt.

9) Trying to stick 100% to the structure of the source text

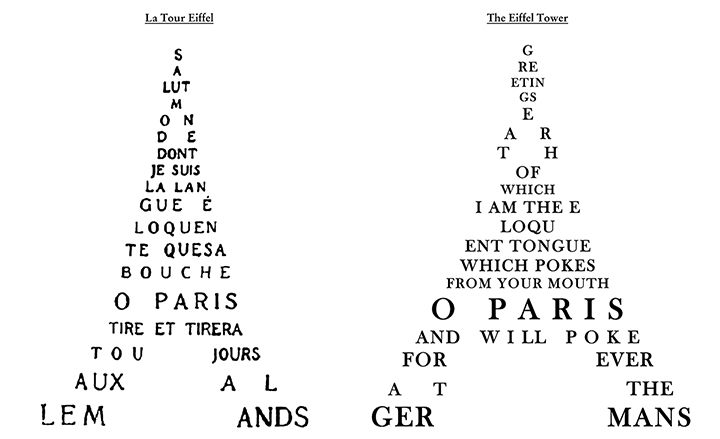
Trying to reproduce absolutely the structure of the source document is very tempting and encouraged by the segmentation process of CAT tools. However, this is lazy. English sentences are known to be shorter than French ones. Therefore, translating a sentence from the latter language might require several in the former. Let’s not speak of German where an entire sentence might end up in a single word! As usual, first comes the meaning, then the rhythm, then the style. Not only this requires to merge/split sentences, it might also require swapping propositions or sentences.

10) Not reading back the complete resulting translation

Last but not least, we should never forget to re-read attentively the entire translation. In the profession, proofreading is often mentioned as an activity disconnected from translation. But no translation work should be considered complete without a proofreading step! This is even more important if CAT software were used. They are known to promote “sentence salads”, where heterogeneous texts, in style and vocabulary, are caused by using the memory of many previous translations.

What about yourself? Which mistake did you make when learning how to become an accurate and efficient translator?

10 tips to model a biological system

By Nicolas Gambardella

You are about to embark on a system biology project which will involve some modelling. Here are a few tips to make this adventure more productive and pleasant.

1 – Think ahead

Do not start building the model without knowing where you are going. What do you want to achieve by building this model? Is it only a quick exercise, a one-off? Or do you want this model to become an important part of your current and future projects? Will the model evolve with your questions and the data you acquire? A model with a handful of variables, created to explore an idea quickly, and a model that will be parameterised with experimental measurements, whose predictions will be tested and that will be further expanded are two completely different beasts. Following the 9 tips below in the former case is overkill, a waste of time. However, in the latter case, cutting corners will cause you unending pain when your project unfolds.

2- Focus on the biology

A good systems biology model aims to be anchored in biological knowledge and even (generally) reflects the system’s behaviours’ biological mechanisms. We are using modelling to understand biology and not using biology to illustrate modelling techniques (which is a perfectly respectable activity but not the focus of this blog post). In order to do so, the model must be built from the processes we want to represent (hence complying with the Minimum Information Requested in the Annotation of Models). Therefore, try to build up your model from reactions (or transitions if this is a Petri Net, rules for a Rule-based model, influences for a Logic model), rather than writing directly the equations controlling the evolution of variables.

Another aspect worth a thought is the existence of different “compartments”. In systems biology, compartments are the “spaces” that contain the biological entities represented by your variables (the word has a slightly different meaning in PKPD modelling, meaning the variable itself). Because compartments can have different sizes, these sizes can change, and they can be used to affect other aspects of the models, it is important to represent them correctly, rather than ignoring them altogether, which was the case for decades.

Many tools have been developed to help you build models that way, such as (but absolutely not limited to) CellDesigner and the excellent COPASI. These software tools are, in general, very user-friendly and more approachable for biologists. An extensive list of tools is available from the SBML software guide.

3- Document as you build

Bookkeeping is a cornerstone of any professional activity, and lab notebooks are scientists’ best friends. Modelling is no exception. If you do not log why you created a variable or a reaction, what biological entities they represent, how you chose the initial values or the boundaries for parameter estimation, you will make your life down the line hell. You will not be able to interpret the results of simulations, modify the model, share it with collaborators, write a publication, etc. You must start this documentation as soon as you begin building the model. Memory fades quickly, and motivation even quicker. The biggest self-delusion (or plain lie) is “I am efficient and focused now, and I must get results done. I will clean up and document the model later.” You will most probably never clean up and document the model. And if you do, you will suffer greatly, trying to remember why the heck you made those choices before.

Several software tools, such as COPASI, provide means of annotating every single element of a model, either with free text, or with controlled annotations. Alternatively, you can use regular electronic notebooks, Google docs, and spreadsheets if you work with others etc. Anything goes, as far as you do create this documentation. Note that you can later share model and documentation at once, either with the documentation included in the model (for instance, in SBML notes and annotation elements) or with model and documentation shared as a single COMBINE Archive.

4- Choose a consistent naming scheme

This sounds like a mundane concern. But it is not! Variable and parameter names are the first layer of documentation (see tip 3). It also anchors your model in biology (tip 2). A naming scheme that is logical and consistent while easy to remember and use will also greatly facilitate future extensions of your model (tip 1). NB: we do not want to open a debate “identifiers versus accession number versus usable name” or the pros and cons of semantics in identifiers (see the paper by McMurry et al for a great discussion on that topic). Here, we talk about the short names one sees in equations, model graphs, etc.

Avoid very long names if not needed (“adenosine triphosphate”), but do not be over-parsimonious (“a”). “ATP” is fine. Short, explicit, clear for most people within a given context. Reuse common practices if possible, even if they are not official. For instance, uppercase K is mostly used for equilibrium constants, lowercase k for rate constants. A model using “Km” for the rate constant of DNA methylase and “kd” for its dissociation constant from DNA would be pretty confusing. Be consistent in the naming. If non-covalent complexes are denoted with an underscore, A_B being a complex between A and B, and hyphens denote covalent modifications, A-P representing the phosphorylated form of A, do not use CDP for the phosphorylated form of the complex between C and D (or, heaven forbid, C-D_P !!!)

5- Choose granularity and independent variables wisely

We often make two mistakes when describing systems in biology mathematically. The first one is a variant of the “spherical cow“. In order to facilitate the manipulation of the model, it is very tempting to create as few independent variables as possible (by variable, we mean here the things we can measure and predict). Those variables can be combinations of others, combinations sometimes only valid in specific conditions. Such simplifications make exploring the different behaviours easier, for instance, with phase portraits and bifurcation plots. A famous example is the two variable version of the cell cycle model by John Tyson in 1991. However, the hidden constraints might not allow the model to reproduce all the behaviours displayed by the biological system. Moreover, reverse engineering the variables to interpret the results could be difficult.

The second, mirroring, mistake is to try modelling the biological system in exquisite details, representing all our knowledge and thus creating too many variables. Even if the mechanisms underlying the interactions between those variables were known (which is most often not the case), the resulting model often contains too many degrees of freedom, effectively allowing any behaviour to be reproduced with some parameter values (making it impossible to falsify). It also becomes challenging to accurately determine the values of all parameters based on a limited number of independent measurements.

It is therefore paramount to choose the right level of granularity. There is no universal and straightforward solution, and we can encounter extreme cases. d’Alcantara et al 2003 represented calmodulin is represented by two variables (total concentration and concentration of active molecules). In Stefan et al 2008, calmodulin is represented by 96 variables (all calcium-binding combinations plus binding to other proteins and different structural conformations). Nevertheless, both papers study the biological phenomenon.

The right answer is to pick the variable granularity depending on the questions asked and the data available. A rule of thumb is to start with a small number of variables that can be matched (directly or via mathematical transformations) with the quantities you have measurements for. Then you can progressively make your model more complex and expressive as you move on while keeping it identifiable.

6- Create your relationships

Once you have defined your variables, you can create the necessary relationships, which are all the mathematical constructs that link variables and parameters together. Graphical software such as CellDesigner or GINsim permit to draw the diagrams representing the processes or the influences respectively.

Note that some software tools provide shorthand notations that permit the creation of variables and parameters directly when writing the reactions. This is very handy for creating small models instantly. However, I would refrain from doing so if you want to document your model properly (it also makes it easier to create spurious variables and “dangling ends” through typos in the variable names).

Working on the relationships after defining the variables also easily permits the model’s modification. For example, you can add or remove a reaction without having to go through the entire model as you would with a list of ordinary differential equations.

7- Choose your math

The beauty of mathematical models is that you can explore a large diversity of possible linkages between molecular species, actual mechanisms hidden behind the “arrow” representing a process. A transformation of X in a compartment into Y in another compartment can be controlled for instance by a constant flux (don’t do that!), a passive diffusion, a rate-limited transport, or even exotic higher-order kinetics. At that point, we could write: [insert clone of tip 5 here]. Indeed, while the mathematical expressions you choose can be arbitrarily complex, the more parameters you have, the harder it will be to find proper values for them.

If the model is carefully designed, switching between kinetics should not be too difficult. A useful habit to take is to preferentially use global parameters (which scope is the entire model/module) rather than parameters defined for a given reaction/mathematical expression. Doing so will, of course, ease the use of the parameter in different expressions and facilitate the documentation and ease future model extensions, for instance, where a parameter no longer has a fixed value but is affected by other things happening in the model.

8- Plug holes and check for mistakes

Now that you have your shiny model, you need to make sure you did not forget to close a porthole that would sink it. Do you have rate laws generating negative concentrations? Conversely, does your model generate umpteen amounts of certain molecules which are not consumed, resulting in preposterous concentrations? Software like COPASI have checks for this kind of thing. In the example below, I created a reaction that consumes ATP to produce ADP and P, with a constant flux. This would result in infinite concentrations of ADP and infinitely negative concentrations of ATP. COPASI catches it, albeit returning a message that could be clearer.

Ideally, a model should be “homeostatic”. All molecular species should be produced and consumed. Pure “inputs” should be produced by creation/import reactions, while pure “outputs” should be consumed by degradation/export reactions. Simulating the model would not lead to any timecourse tending to either +∞ or -∞.

9- Create output

“A picture is worth a thousand words”, and the impact of the results you obtained with such a nice will be greater if served in clear, attractive and expressive figures. Timecourses are useful. But they are not always the best way to present the key message. You want to show the effect of parameter values on molecular species’ steady-states? Try parameter scanning plots, and their derivatives, such as bifurcation plots. Try phase-portraits. Distributions of concentrations during stochastic simulations or after ensemble simulations can be represented with histograms. And why being limited to 2D-plots? Use 3D plots and surfaces instead, possibly in conjunction with interactive display (plot.ly …).

10- Save your work!

Finally, and this is quite important, save often and save all versions. Models are code, and code must be versioned. You never know when you will realise you made a mistake and will want to go back a few steps and start exploring a different direction. You certainly do not want to start all over again. Recent work explored ways of comparing model versions (see the works from the Waltemath group, for instance). But we are still some way off the possibility of accurately “diff and merge” as it is done on text and programming code. The safest way is to save all the significant versions of a model separately.

Have fun modelling!

Using medians instead of means for single cell measurements

By Nicolas Gambardella

In the absence of information regarding the structure of variability (whether intrinsic noise, technical error or biological variation), one very often assumes, consciously or not, a normal distribution, i.e. a “bell curve”. This is probably due to an intuitive application of the central limit theorem which stipulates that when independent random variables are added, their normalized sum tends toward such a normal distribution, even if the original variables themselves are not normally distributed. The reasoning then goes that any biological process is the sum of many sub-processes, each with its own variability structure, therefore its “noise” should be Gaussian.

Although that sounds almost common sense, alarm bells start ringing when we use such distributions with molecular measurements. Firstly, a normal distribution ranges from -∞ to +∞. And there is no such things as negative amounts. So, at most, the variability would follow a truncated normal distribution, starting at 0. Secondly, the normal distribution is symmetrical. However, in everyday conversation, the biologists will talk of a variability “reaching twofold”. For a molecular measurement, a two-fold increase and a two-fold decrease do not represent the same amount. So there is an asymmetric notion here. We are talking about linking the addition and removal of the same “quantum of variability” to a multiplication or division by a same number. Immediately logarithms come to mind. And log2 fold changes are indeed one of the most used method to quantify differences. Populations of molecular measurements can also be – sometimes reasonably – fitted with log-normal distributions. Of course, several other distributions have been used to fit better cellular contents of RNA and protein, including the gamma, Poisson and negative binomial distributions, as well as more complicated mix.

Let’s look at some single-cell gene expression measurements. Below, I plotted the distribution of read counts (read counts per million reads to be accurate) for four genes in 232 cells. The asymmetry is obvious, even for NDUFAB1 (the acyl carrier protein, central to lipid metabolism). This dataset was generated using a SmartSeq approach and Illumina HiSeq sequencing. It is therefore likely that many of the observed 0 are “dropouts”, possibly due to the reverse transcriptase stochastically missing the mRNAs. This problem is probably even amplified with methods such as Chromium, that are known to detect less genes per cell. Nevertheless, even if we remove all 0, we observe extremely similar distributions.

One of the important consequences of the normal distribution’s symmetry, is that mean and median of the distribution are identical. In a population, we should have the same amounts of samples presenting less and presenting more substance than the mean. In other words, a “typical” sample, representative of the population, should display the mean amount of the substance measured. It is easy to see that this is not the case at all for our single cell gene expressions. The numbers of cells expressing more than the mean of the population are 99 for ACP (not hugely far from the 116 of the median), 86 for hexokinase, 78 for histone acetyl transferase P300 and 30 for actin 2. In fact, in the latter case, the median is 0, mRNAs having been detected in only 50 of the 232 cells ! So, if we take a cell randomly in the population, most of the time it presents a count of 0 CPM of actin 2. The mean expression of 52.5 CPM is certainly not representative!

If we want to model the cell type, and provide initial concentrations for some messenger RNAs, we must use the median of the measurements, not the mean (of course, the best route of action would be to build an ensemble model, cf below). The situation would be different if we wanted to model the tissue, that is a sum of non individualised cells representative of the population.

To explain how such asymmetric distributions can arise from noise following normal distributions, we can build a small model of gene expression. mRNA is transcribed at a constant flux, with a rate constant kT. It is then degraded following a unimolecular decay with rate kdeg (chosen to be 1 on average, for convenience). Both rate constants are computed from energies, following the Arrhenius equation, k = Ae-(E/RT), where R is the gas constant, 8.314 and T is the temperature, that we set at 310 K (37 deg C). To simplify we’ll just set the scaling factor A to 1, assuming it is included in the reference energy. E is 0 for degradation, and we modulate the reference transcription energy to control the level of transcript. Both transcription and degradation energy will be affected by normally distributed noises that represent differences between cells (e.g. concentration and state of enzymes). So Ei = E + noise. Because of Arrhenius equation, the normal distributions of energy are transformed into lognormal distributions of rates. Below I plot the distributions of the noises in the cells and the resulting rates.

The equilibrium concentration of the mRNA is then kdeg/kT (we could run stochastic simulations to add temporal fluctuations, but that would not change the message). The number of molecules is obtained by multiplying by volume (1e-15 l) and Avogadro number. Each panel presents 300 cells. The distribution on the top-left looks kind of intermediate between those of hexokinase and ACP above. To get the values on the top-right panel, we simulate an overall increase of the transcription rate by twofold, using a decrease of the energy by 8.314*310*ln(2). In this specific case, the observed ratios between the two medians and between the two means are both about 2.04, close to the “truth”. So we could correctly infer a twofold increase by looking at the means. In the bottom panels, we increase the variability of the systems by doubling the standard deviation of the energy noises. Now the ratio of the median is 1.8, inferring a 80% increase while the ratio of the means is 2.53, inferring an increase of 153%!

In summary:

  1. Means of single cell molecular measurements are not a good way of getting a value representing the population;
  2. Comparing the means of single measurements in two populations does not provide an accurate estimation of the underlying changes;

10 tips to improve your research articles

By Nicolas Gambardella

Since an important part of our activity is to assist researchers by improving their documents, whether grant applications, research publications or project reports, this blog will come back to this topic on a regular basis. We will write in depth about every aspects of scientific writing in turn. In this initial post let’s go wide and list a few general rules to improve research papers (although most of those apply to grant applications too).

1) Find your message

Of course, any body of scientific research brings about multiple results, that in turns affect the way we understand several aspects of reality, or can lead to a few technical developments. However, in order to maximize the impact of your account, you must choose an angle. What is the main point you want people to remember? What would be the sentence accompanying a tweet linking to your paper?

2) Know your audience

Once you have settled on your message, you need to select the population you want to “sell it too”, on which you expect the maximum impact. By audience, we mean first and foremost the editor and the reviewers. Yes, your ultimate aim is to spread the news through your community. But the paper needs to be published first … Knowing who you are talking to will help you structure the paper, as much as the instructions to authors. What will you put in the main body of the paper and what will you demote to supplementary materials? What should you present in detail or on the contrary gloss over? How will you present the methods and the results? Experimental biologists tend to dislike equations. Biochemists do not care much about the illustrating experiment, but want quantitative tables. Molecular biologists love histograms, and they like to have one illustrating experiment such as a a western blot or a microscopy field.

3) Build a storyline

Keeping in mind both the message you chose and the audience you want to sell it to, create a progressive demonstration that brings the reader to the same conclusions as yours, keeping them focused until the final bang. This is not necessarily how things really happened, in particular chronologically. We all know that scientific research is a complex process, that includes iterative explorations, validations and controls, explode dead ends etc. There is no need to list everything path you explored, every experiment you did. A paper is not a laboratory notebook. However, as you progress towards in your narrative, each step need to naturally lead to the next, while the controls you describe preclude wandering off-path.

4) Keep facts and ideas where they belong

Do not mix Introduction, Materials and Methods, Results and Discussion (in some article structures, the last two can be included in the same section, but the relevant bits are generally in different paragraph). The Introduction should only present and discuss what was known before your work, and only what is needed to understand your work and its context. Similarly, the Materials and Methods section should not describe new techniques or materials. And finally, all your results should be in the Results section (if separate from the Discussion). As a rule, if you remove everything but the Results section, you should not affect the storyline described above. Our advice is to start writing the Results, the add the necessary Materials and Methods as you go, write the Discussion, and finish by the Introduction. You cannot write an effective introduction if you do not know what you want to introduce. Moreover, writing the introduction is often used as a procrastination device …

5) Build modules

Use one paragraph for one idea, if possible linked to one experiment, and illustrated by one figure (whether the figure ends up in the main body or in supplementary materials does not matter). This is sometime challenging when the idea or the experiment are complex. But even if, in the end, paragraphs are merged or split, adopting this approach is useful during the initial writing stage. This will help building the storyline and will enable easy restructuring later. Give a title to each module. Try drawing a flowchart representing your results, and annotate it with experiments and figures.

6) Do not assume knowledge but do not state the obvious

Moving from the structure to the style now. It is always difficult to decide what is common knowledge and therefore should not be explicit, and what is specialized knowledge required to understand your story and accept your message. Do not rely on your own knowledge. Go back to point 2), and make a real effort to put yourself in the shoes of the intended readership. Then a guideline can be to introduce factual knowledge but not common – in your audience’s domain – technical knowledge. For instance, if you write for biologists, you should not assume that people know the Kd between PKA and cAMP is 0.1 micromolar. However, you may assume that readers know increased affinity means lower Kd.

7) Do not repeat information

Building your text following 5) should preclude the description of the same information twice. When you refer to a piece of information described before, you do not need to restate it. This goes for details of experiments as well. If you already stated that an experiment took place in a chemical reactor, there is no need to mention it all the time, as “the solution in the chemical reactor” “the temperature in the chemical reactor” etc.

8) Write clearly, concisely and elegantly

I strongly recommend reading, and keeping a copy at hand, “Style: Lessons in Clarity and Grace“. There are many simple habits you can use to improve the readability of a text. Avoid passive forms. Keep verbs for actions and nouns for what perform or is affected by such actions. Try to stick to one proposition per sentence, twice at most (and well articulated). Do not add words needlessly. Instead of writing “the oxidation of the metal”, write “metal oxidation”. A shorter text is read faster and is easier to memorize.

9) Avoid casual writing

A scientific article is not a diary (or a blog post …). Your reader is neither your mate nor your student. Avoid talking to them directly, e.g. “you can do this” or indirectly as “let’s consider this first”. This is not a huge deal, but it might be irritating for some people. In general, adopt the style commonly used in the most respectable journals of the community you are targeting.

10) Chase grammatical errors and spelling mistakes

They are less important than the scientific facts, and hopefully they will disappear during the proof-reading stage. However, they give a hint of sloppiness, and they will annoy the reviewers. Even if those reviewers do not belong to the type focusing on such things, unconscious biases can taint even the fairer person. So read your manuscript again and again, slowly and aloud. More importantly ask someone else, if possible not a co-author, to read it as well.

Concentric heatmaps to compare gene network features

By Nicolas Gambardella

A frequent outcome of network inference based on gene expression data is the discovery of “hubs”, that possibly represent master regulators of our system of interest. Analyzing and comparing those hubs is often at the core of new biological insights. A problem of visualizing network “hubs” is the sheer number of neighbours, that make identification of interesting nodes difficult, and might mask the overall message. The overlay of several features on a nodes, using for instance several colouring or size contributes to the general confusion. Here, we propose to go back from the hub to the wheel, representing each neighbour as a tile in a 360 degree heatmap. In addition, we will used several concentric heatmaps to enable a quick integration of different features. Insight will then come from the comparison of several such wheels.

Of course, tools already exist to represent complex datasets in exquisite circular representations, such as Circos or the R package circlize. But here we will only use ggplot2 and a bit of magic.

Here is the final figure, showing two transcription factors with their targets, characterised by their expression in cell types, brain regions and the strength of interaction with the hub TFs:

First, we need some data. Using a transcriptomics dataset, we inferred a gene regulatory network (this part of the work is beyond this blog post). The dataset was composed of two cells types coming from two different regions of the brain. For each gene, we computed the log fold difference between regions and between cell types. Our initial edges data table looks like:

TFx are the hub transcription factors that we identified as of interest. neighbor list the top interactors for each hub, weight is a dimensionless factor that represents the significativity of the edge. The higher the more probabl an actual inference exists. The table is ordered by decreasing edge weights.

We will need a few packages.

library(reshape)
library(ggplot2)
library(ggnewscale)   ## The magic

Then we will generate a wheel for a given transcriptions factor (we can, of course, generate a whole bunch of wheels in one go). We extract the information for all its neighbors, and we recast the table using the melt function of the package reshape. We then add an index (var2 below) that will decide where each data will be positioned on the concentric rings..

tf3 <- subset(edges,edges$hub == "TF3")[,-1]
tf3.m <- melt(tf3)
tf3.m$var2<-NA
tf3.m[tf3.m$variable == "weight",]$var2 <- 6
tf3.m[tf3.m$variable == "CellType",]$var2 <- 7
tf3.m[tf3.m$variable == "Region",]$var2 <- 8

Here is what the new table looks like:

The index starts at 6 so that we have an empty space in the centre corresponding to 5 rings. Now, let’s see the beauty of ggplot2 layered approach in action. We will start with what will be our external ring, the relative expression in different regions.

ptf3 <- ggplot( ) +
  geom_tile(data=tf3.m[tf3.m$variable == "Region",],
            aes(x=as.numeric(rownames(tf3.labs)),y=var2, fill=value),
            colour="white")
plot(ptf3)

The default colours are not so nice. Since we want to emphasize the extreme differences of expression, a divergent palette is better suited. Moreover, as we mention above, we want to compare this hub with others. Therefore, the colours must be scaled according to the values across the whole dataset (the initial table edges).

 ptf3 <- ptf3 +
  scale_fill_gradient2(midpoint=0, mid="white",
                       low=rgb(204/255,102/255,119/255),
                       high=rgb(17/255p,119/255,51/255),
                       limits = c(min(edges$Region),max(edges$Region)), name="Region" )
plot(ptf3)

We said above we wanted space in the middle. We also want space outside for further labelling.

ptf3 <- ptf3 +
  ylim(c(0, max(tf3.m$var2) + 1.5)) 
plot(ptf3)

Did we mention we wanted a circular plot?

ptf3 <- ptf3 +
  coord_polar(theta="x")
plot(ptf3) 

Now, let’s get rid of the useless graphical features that only serve to dilute the main message.

ptf3 <- ptf3 +
  theme(panel.background = element_blank(), # bg of the panel
        panel.grid.major = element_blank(), # get rid of major grid
        panel.grid.minor = element_blank(), # get rid of minor grid
        axis.title=element_blank(),
        panel.grid=element_blank(),
        axis.text.x=element_blank(),
        axis.ticks=element_blank(),
        axis.text.y=element_text(size=0))
plot(ptf3) 

Finally, we can plot the gene names. In order to optimize the readability and use of space, we will plot the names in a radial fashion, but try to make them upright as much as possible. To do so, we need first to compute an angle that depends on the position in the ring. And then, we will compute the required “horizontal” justification, which, when use in conjunction with polar coordinates, produces something quite non-intuitive.

tf3.labs <- subset(tf3.m, variable == "weight")
tf3.labs$ang <- seq(from=(360/nrow(tf3.labs))/1.5, 
                    to=(1.5* (360/nrow(tf3.labs)))-360, 
                    length.out=nrow(tf3.labs))+80

tf3.labs$hjust <- 0
tf3.labs$hjust[which(tf3.labs$ang < -90)] <- 1
tf3.labs$ang[which(tf3.labs$ang < -90)] <- (180+tf3.labs$ang)[which(tf3.labs$ang < -90)]

Now we can add the labels to the plot. Now the use of extra space around the ring becomes clear.

ptf3 <- ptf3 +
  geom_text(data=tf3.labs, 
            aes(x=as.numeric(rownames(tf3.labs)), 
                y=var2+2.5, 
                label=neighbor, angle=ang, hjust=hjust), 
            size=2.5)
plot(ptf3) 

All good. Now that we have plotted the relative expression in different regions, let’s plot the relative expression in different cell types. The first intuitive idea would be to just add a new heatmap inside the previous one. However, since we are talking about a different feature, we want a different colour scale.

ptf3 <- ptf3 + 
  geom_tile(data=tf3.m[tf3.m$variable == "CellType",],
            aes(x=as.numeric(rownames(tf3.labs)),y=var2, fill=value),
            colour="white") +
  scale_fill_gradient2(midpoint=0, mid="white",
                       low=rgb(221/255,204/255,119/255),
                       high=rgb(68/255,119/255,170/255),
                       limits = c(min(edges$CellType),max(edges$CellType)), name="CellType" )
plot(ptf3)

Arrgh! First we get an error “Scale for ‘fill’ is already present. Adding another scale for ‘fill’, which will replace the existing scale.” And indeed, the CellType colour scale replaced the Region one for the outer ring. This is because we can only use a single colour scale within a given ggplot2 plot. But not all is lost, thanks to the package ggnewscale which allows us to redefine the colour scale.

NB: Packages like ComplexHeatmap allow to use different colorRamps for different heatmaps. However, they do not allow the use of polar coordinates.

So, here is what we are going to do. We will redefine the scale twice, in order to plot three features on three different concentric heatmaps.

ptf3<-ggplot( ) +
  geom_tile(data=tf3.m[tf3.m$variable == "Region",],
            aes(x=as.numeric(rownames(tf3.labs)),y=var2, fill=value),
            colour="white") +
  scale_fill_gradient2(midpoint=0, mid="white",
                       low=rgb(204/255,102/255,119/255),
                       high=rgb(17/255,119/255,51/255),
                       limits = c(min(edges$Region),max(edges$Region)), name="Region" )+
  new_scale("fill") +   #### MAGIC
  geom_tile(data=tf3.m[tf3.m$variable == "CellType",],
            aes(x=as.numeric(rownames(tf3.labs)),y=var2, fill=value),
            colour="white") +
  scale_fill_gradient2(midpoint=0, mid="white",
                       low=rgb(221/255,204/255,119/255),
                       high=rgb(68/255,119/255,170/255),
                       limits = c(min(edges$CellType),max(edges$CellType)), name="CellType" )+
  new_scale("fill") +   #### MAGIC
  geom_tile(data=tf3.m[tf3.m$variable == "weight",],
            aes(x=as.numeric(rownames(tf3.labs)),y=var2, fill=value),
            colour="white") +
  scale_fill_gradient2(midpoint=0, mid="white",
                       low=rgb(250/255,250/255,250/255),
                       high=rgb(0/255,0/255,0/255),
                       limits = c(min(edges$weight),max(edges$weight)), name="Weight" )+
  ylim(c(0, max(tf3.m$var2) + 1.5)) +
  coord_polar(theta="x") +
  theme(panel.background = element_blank(), # bg of the panel
        panel.grid.major = element_blank(), # get rid of major grid
        panel.grid.minor = element_blank(), # get rid of minor grid
        axis.title=element_blank(),
        panel.grid=element_blank(),
        axis.text.x=element_blank(),
        axis.ticks=element_blank(),
        axis.text.y=element_text(size=0))+
  geom_text(data=tf3.labs, 
            aes(x=as.numeric(rownames(tf3.labs)), 
                y=var2+2.5, 
                label=neighbor, angle=ang, hjust=hjust), 
            size=2.5)
plot(ptf3)

Now we can compare the differential expression of our hub’s neighbours between cell types and between regions. We can do that for several hubs, and compare them, which brings us to our complete figure below. We can see that while the expression of TF3’s neighbours tend to differ strongly between cell types (vivid blues and yellows), they do not differ much between regions (pale greens and magentas). We observe the opposite pattern for TF7, suggesting that TF3 could be regulating spatial-independent cell identity and TF7 could be regulating spatial-dependent cell features.

We are grateful to the following sources that benefited much to this blog post:

  • https://stackoverflow.com/questions/13887365/circular-heatmap-that-looks-like-a-donut
  • https://eliocamp.github.io/codigo-r/2018/09/multiple-color-fill-scales-ggplot2/