By Nicolas Gambardella
[disclaimer: I wrote the first version of this text in 2018. Some of its descriptions might thus be slightly out of date]
Visual representation of biochemical pathways has been a critical tool for understanding the cellular and molecular systems for a long time. Any knowledge integration project involves a jigsaw puzzle step, where different pieces must be put together. When Feynman cheekily wrote on his blackboard just before his death, “What I cannot create I do not understand”, he meant that he only fully understood a system once he derived a (mathematical) model for it; and interestingly, Feynman is also famous for one of the earliest standard graphical representations of reaction networks, namely the Feynman diagrams to represent models of subatomic particle interactions. The earliest metabolic “map” I possess comes from the 3rd edition of “Outlines of Biochemistry” by Gortner published in 1949. I would be happy to hear if you have older ones.
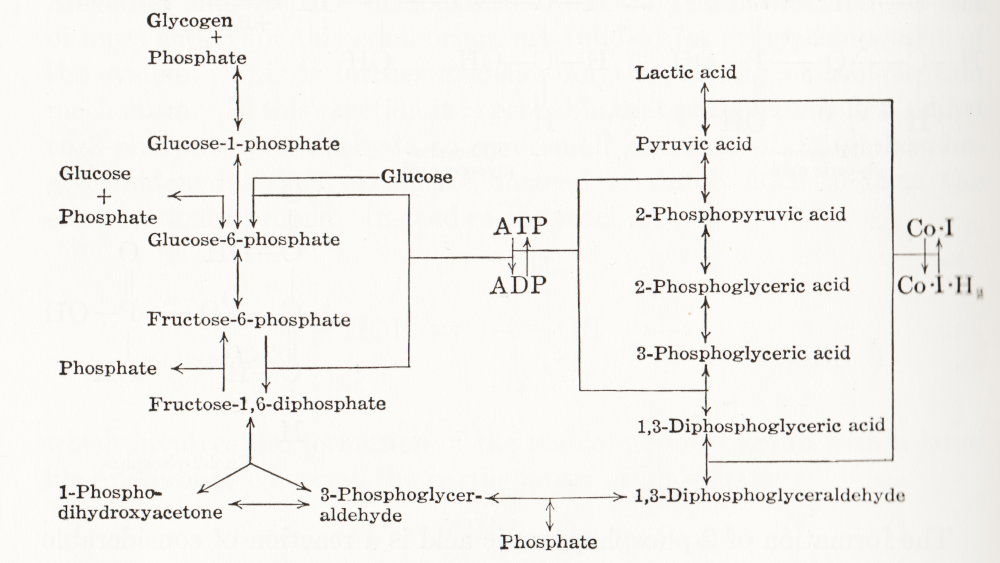
(I let you find out all the inconsistencies, confusing bits, and error-generating features in this map. This might be food for another text, but I believe this to be a great example to support the creation of standards, best practices, and software tools!)
Until recently, those diagrams were drawn mainly by hand, initially on paper, then using drawing software. There was little thought spent on consistency, visual semantics, or interoperability. This state of affairs changed in the 1990s as part of Systems Biology’s revival. The other thing that changed in the 1990s was the widespread use of computers and software tools to build and analyse models. The child of both trends was the development of standard computer-readable formats to represent biological networks.
When drawing a knowledge representation map, one can divide the decision-making process, and therefore the things we need to encode in order to share the map, into three parts:
What – How can people identify what I represent? A biochemical map is a network built up from nodes linked by arcs. The network may contain only one type of node, for instance, a protein-protein interaction network or an influence network, or be a bipartite graph, like a reaction network – one type of node representing the pools involved in the reactions, the other representing the reactions themselves. One decision is the shape to use for each node so that it carries visual information about the nature of what it represents. Another concerns the arcs linking the nodes, which can also contain visual clues, such as directionality, sign, type of influence, and more. All this must be encoded in some way, either semantically (a code identifying the type of glyphs from an agreed-up list of codes) or graphical (embedding an image or describing the node).
Where – After choosing the glyphs, one needs to place them. The relative position of the information should not always carry much information, but there are some cases where it must, e.g. members of complexes, inclusion in compartments, etc. Furthermore, there is no denying that the relative position of glyphs is also used to convey more subjective information. For instance, a linear chain of reactions induces the idea of a flow, much better than a set of reactions going randomly up and down, right and left. Another unwritten convention is to represent membrane signal transduction on the top of the maps, with the “end-result” – often effect on gene expression – at the bottom, with the idea of a cascading flux of information. The coordinates of the glyphs must then be shared as well.
How – Finally, the impact of a visual representation also depends on aesthetic factors. The relative size of glyphs and labels, the thickness of arcs, the colours, shades and textures, all influence the facility with which viewers absorb the information contained in a map. Relying on such aspects to interpret the meaning of a map should be avoided, particularly if the map is to be shared between different media, where rendering could affect the final aspect. Nevertheless, wanting to keep this aspect as close as possible makes sense.
A bit of history
Different formats have been developed over the years to cover these different aspects with different accuracy and constraints. In order to understand why we have such a variety of description formats on offer, a bit of history might be helpful. Being able to encode the graphical representation of models in SBML was mentioned as early as 2000 (Andrew Finney. Possible Extensions to the Systems Biology Markup Language. 27 November 2000).
In 2002, the group of Hiroaki Kitano presented a graphical editor for the Systems Biology Markup Language (SBML, Hucka et al 2003, Keating et al 2020), called SBedit, and proposed extensions to SBML necessary for encoding maps (Tanimura et al. Proposal for SBEdit’s extension of SBML-Level-1. 8 July 2002). This software later became CellDesigner (Funahashi et al 2003), a full-featured modelling developing environment using SBML as its native format. All graphical information is encoded in CellDesigner-specific annotations using the SBML extension system. In addition to the layout (the where), CellDesigner proposed a set of standardised glyphs to use for representing different types of molecular entities and different relationships (the what) (Kitano et al 2003). At the same time, Herbert Sauro developed an extension to SBML to encode the maps designed in the software JDesigner (Herbert Sauro. JDesigner SBMLAnnotation. 8 January 2003). Both CellDesigner and JDesigner annotations could also encode the appearance of glyphs (the how).
In 2003, Gauges et al (Gauges et al. Including Layout information in SBML files. 13 May 2003) proposed to split the description of the layout (the where) and the rendering (the what and the how) and focus on the layout part in SBML (Gauges et al 2006). Eventually, this effort led to the development of two SBML Level 3 Packages, Layout (Gauges et al 2015, Keating et al 2020) and Render (Bergmann et al 2017, Keating et al 2020).
Once the SBML Layout annotations were finalised, the SBML and BioPAX communities came together to standardise visual representations for biochemical pathways. This led to the Systems Biology Graphical Notation, a set of three standard graphical languages with agreed-upon symbols and rules to assemble them (the what, Le Novère et al 2009). While the shape of SBGN glyphs determines their meaning, neither their placement in the map nor their graphical attributes (colour, texture, edge thickness, the how) affect the map semantics. SBGN maps are ultimately images and can be exchanged as such, either in bitmaps or vector graphics. They are also graphs and can be exchanged using graph formats like GraphML. However, sharing and editing SBGN maps would be much easier if more semantics were encoded than graphical details. This feeling led to the development of SBGN-ML (van Iersel et al 2012), which encodes not only the SBGN part of SBGN maps but also the layout and size of graph elements.
So we have at least three solutions to encode biochemical maps using XML standards from the COMBINE community (Hucka et al 2015):
1) SBGN-ML,
2) SBML with Layout extension (controlled Layout annotations in Level 2 and Layout package in Level 3), and
3) SBML with proprietary extensions.
Regarding the latter, we will only consider the CellDesigner variant for two reasons. Firstly, CellDesigner is the most used graphical model designer in systems biology (at the time of writing, the articles describing the software have been cited over 1000 times). Secondly, CellDesigner’s SBML extensions are used in other software tools. These three solutions are not equivalent; they present different advantages and disadvantages, and round-tripping is generally impossible.
SBGN-ML
Curiously, despite its name, SBGN-ML does not explicitly describe the SBGN part of the maps (the what). Since the shape of nodes is a standard, it is only necessary to mention their type, and any supporting software will know which symbol to use. For instance, SBGN-ML will not specify that a protein X must be represented with a round-corner rectangle. It will only say that there is a macromolecule X at a particular position with given width and height. Any SBGN-supporting software must know that a round-corner rectangle represents a macromolecule. The consequence is that SBGN-ML cannot be used to encode maps using non-SBGN symbols. However, software tools can decide to use different symbols attributed to a given class of SBGN objects while rendering the maps. For example, instead of using a round-corner rectangle each time a glyph’s class is macromolecule, it could use a star. The resulting image would not be an SBGN map. However, if modified and saved back in SBGN-ML, it could be recognised by another supporting software. Such behaviour is not to be encouraged if we want people to get used to SBGN symbols, but it provides a certain level of interoperability.
What SBGN-ML explicitly describes instead are the parts that SBGN itself does not regulate but are specific to the map. That includes the size of the glyphs (bounding box), the textual labels, as well as the positions of glyphs (the where). SBGN-ML currently does not encode rendering properties such as text size, colours and textures (the how). However, the language provides an element extension, analogous to the SBML annotation, that allows augmenting the language. One can use this element to extend each glyph or encode style, and the community started to do so in an agreed-upon manner.
Note that SBGN-ML only encodes the graph. While it contains a certain amount of biological semantics – linked to the identity of the glyphs – it is not a general-purpose format that would encode advanced semantics of regulatory features such as BioPAX (Demir et al. 2010), or mathematical relationships such as SBML. However, users can distribute SBML files along with SBGN-ML files, for instance, in a COMBINE Archive (Bergmann et al 2014). Unfortunately, there is currently no blessed way to map an SBML element, such as a particular species, to a given SBGN-ML glyph.
SBML Level 3 + Layout and Render packages
As we mentioned before, SBML Level 3 provides two packages helping with the visual representations of networks: Layout (the where) and Render (the how). Contrarily to SBGN-ML, which is meant to describe maps in a standard graphical notation, the SBML Level 3 packages do not restrict the way one represents biochemical networks. This provides more flexibility to the user but decreases the “stand-alone” semantics content of the representations. I.e. if non-standard symbols are used, their meaning must be defined in an external legend. It is, of course, possible to use only SBGN glyphs to encode maps. The visual rendering of such a file will be SBGN, but the automatic analysis of the underlying format will be more challenging.
The SBML Layout package permits encoding the position of objects, points, curves and bounding boxes. Curves can have complex shapes encoded as Béziers curves. The package allows distinguishing between different general types of nodes such as compartments, molecular species, reactions and text. However, there is little biological semantics encoded by the shapes, either regarding the nodes (e.g. nothing distinguishes a simple chemical from a protein) or the edges (one cannot distinguish an inhibition from a stimulation). In addition, the SBML Render package permits to define styles that can be applied to types of glyphs. This includes colours and gradients, geometric shapes, properties of text, lines, line-endings etc. Render can encode a wide variety of graphical properties, and pave the gap to generic graphical formats such as SVG.
If we are trying to visualise a model, one advantage of using SBML packages is that all the information is included in a single file, providing a straightforward mapping between the model constructs and their representation. This goes a long way to solve the issue of the biological semantics mentioned above since it can be retrieved from the SBML Core elements linked to the Layout elements. Let us note that while SBML Layout+Render do not encode the nature of the objects represented by the glyphs (the what) using specific structures, this can be retrieved via the attributes sboTerm of the corresponding SBML Core elements, using the appropriate values from the Systems Biology Ontology (Courtot et al 2011).
CellDesigner notation
CellDesigner uses SBML (currently Level 2) as its native language. However, it extended it with its own proprietary annotation, keeping the SBML perfectly valid (which is also the way software tools such as JDesigner operate). Visually, the CellDesigner notation is close to SBGN Process Descriptions, having been the strongest inspiration for the community effort. CellDesigner offers an SBGN-View mode, that produces graphs closer to pure SBGN PD.
CellDesigner’s SBML extensions increase the semantics of SBML elements such as molecular species or regulatory arcs in a way not dissimilar to SBGN-ML. In addition, it provides a description of each glyph linked to the SBML elements, covering the ground of SBML Layout and Render. The SBML extensions being specific to CellDesigner, they do not offer the flexibility of SBML Render. However, the limited spectrum of possibilities might make the support easier.
| CellDesigner notation | SBML Layout+Render | SBGN-ML | |
| Encodes the what | ✓ | ✓ | ✓ |
| Encodes the where | ✓ | ✓ | ✓ |
| Encodes the how | ✓ | ✓ | ✓ |
| Contains the mathematical model part | ✓ | ✓ | ✗ |
| Writing supported by more than 1 tool | ✗ | ✓ | ✓ |
| Reading supported by more than 1 tool | ✓ | ✓ | ✓ |
| Is a community standard | ✗ | ✓ | ✓ |
Examples of usages and conversions
Now let us see the three formats in action. We start with SBGN-ML. First, we can load a model – for instance from BioModels (Chelliah et al 2015 ) – in CellDesigner (version 4.4 at the time of writing). Here we will use the model BIOMD0000000010, an SBML version of the MAP kinase model described in Kholodenko et al (2000).
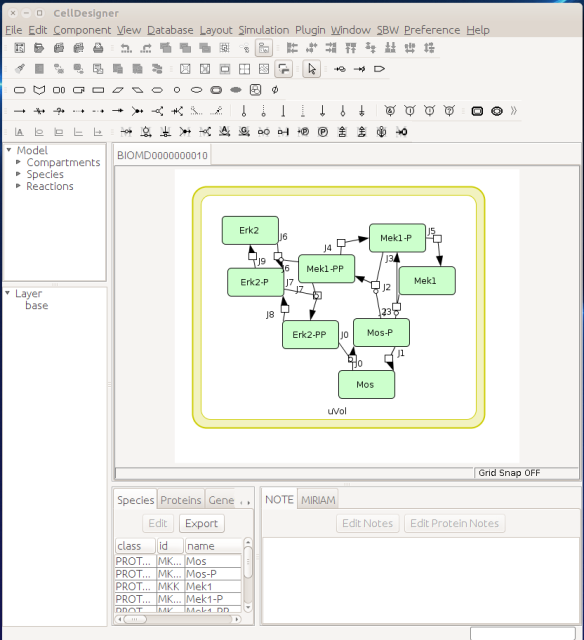
From an SBML file that does not contain any visual representation, CellDesigner created one using its auto-layout functions. One can then export an SBGN-ML file. This SBGN-ML file can be imported, for instance, in Cytoscape (Shannon et al. 2003) 2.8 using the CySBGN plugin (Gonçalves et al 2013).

The position and size of nodes are conserved, but edges have different sizes (and the catalysis glyph is wrong). The same SBGN-ML file can be open in the online SBGN editor Newt.
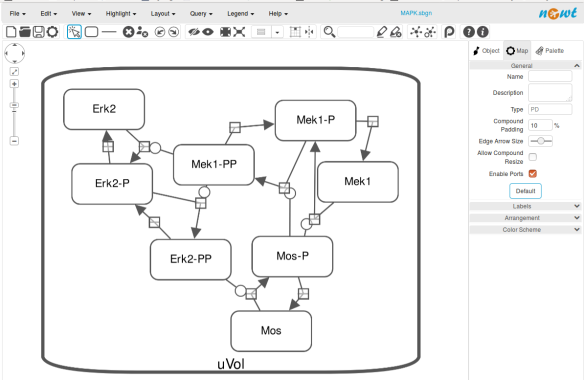
An alternative to CellDesigner to produce the SBGN-ML map could be Vanted (Junker et al 2006, version 2.6.4 at the time of writing). Using the same model from BioModels, we can auto-layout the map (we used the organic layout here) and then convert the graph to SBGN using the SBGN-ED plugin (Czauderna et al 2010).
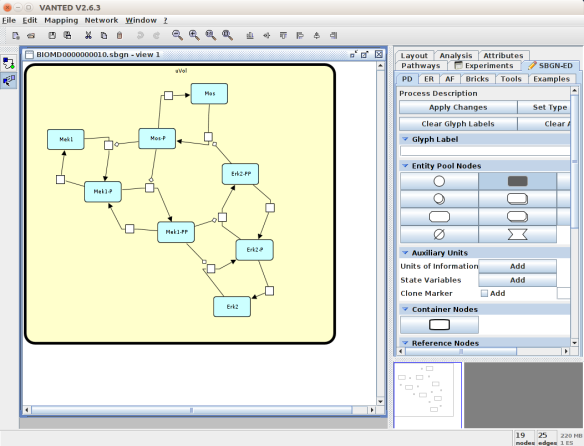
The map can then be saved as SBGN-ML and as before, opened in Newt.

The positions of the nodes are conserved. However, the connection of edges is a bit different. In that case, Newt is slightly more SBGN compliant.
Then, let us start with a vanilla SBML file. We can import our BIOMD0000000010 model in COPASI (Hoops et al 2006, version 4.22 at the time of writing). COPASI now offers auto-layout capabilities, with the possibility of manually editing the resulting maps.
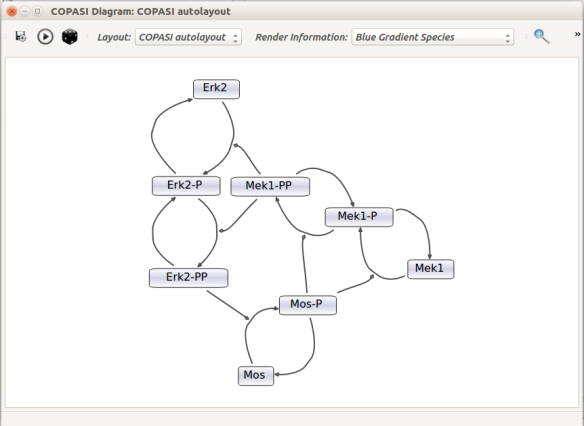
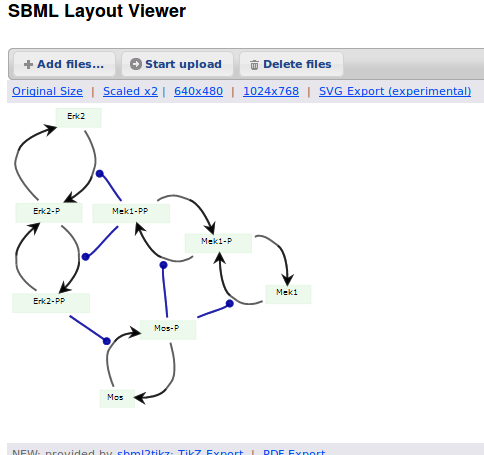
When we export the model in SBML, it will now contain the map encoded with the Layout and Render packages. When the model is uploaded in any software tool supporting the packages, we will retrieve the map. For instance, we can use the SBML Layout Viewer. Note that if the layout is conserved, it is not the case with the rendering.
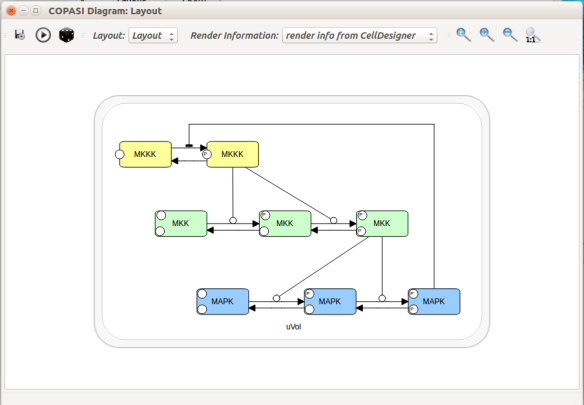
Alternatively, we can load the model to CellDesigner, and manually generate a nice map (NB: a CellDesigner plugin that can read SBML Layout was implemented during Google Summer of Code 2014 . It is part of the JSBML project).

We can create an SBML Layout using the CellDesigner layout converter. Then, when we import the model in COPASI, we can visualise the map encoded in Layout. NB: here, the difference in appearance is due to a problem in the CellDesigner converter, not COPASI.
The same model can be loaded in the SBML Layout Viewer.

How do I choose between the formats?
There is, unfortunately, no unique solution at the moment. The main question one has to ask is what do we want to do with the visual maps?
Are they meant to be a visual representation of an underlying model, the model being the critical part that needs to be exchanged? If that is the case, SBML packages or CellDesigner notation should be used.
Does the project mostly/only involves graphical representations, and those must be exchanged? CellDesigner or SBGN-ML would therefore be better.
Does the rendering of graphical elements matter? In that case, SBML packages or CellDesigner notations are currently better (but that is going to change soon).
Is standardisation important for the project, in addition to immediate interoperability? If yes, SBML packages or SBGN-ML would be the way to go.
All those questions and more have to be clearly spelt out at the beginning of a project. The answer will quickly emerge from the answers.
Acknowledgements
Thanks to Frank Bergmann, Andreas Dräger, Akira Funahashi, Sarah Keating, Herbert Sauro for help and corrections.
References
Bergmann FT, Adams R, Moodie S, Cooper J, Glont M, Golebiewski M, Hucka M, Laibe C, Miller AK, Nickerson DP, Olivier BG, Rodriguez N, Sauro HM, Scharm M, Soiland-Reyes S, Waltemath D, Yvon F, Le Novère N (2015) COMBINE archive and OMEX format: one file to share all information to reproduce a modeling project. BMC Syst Biol 15, 369. doi:10.1186/s12859-014-0369-z
Bergmann FT, Keating SM, Gauges R, Sahle S, Wengler K (2017) Render, Version 1 Release 1. Available from COMBINE <http://identifiers.org/combine.specifications/sbml.level-3.version-1.render.version-1.release-1>
Chelliah V, Juty N, Ajmera I, Raza A, Dumousseau M, Glont M, Hucka M, Jalowicki G, Keating S, Knight-Schrijver V, Lloret-Villas A, Natarajan K, Pettit J-B, Rodriguez N, Schubert M, Wimalaratne S, Zhou Y, Hermjakob H, Le Novère N, Laibe C (2015) BioModels: ten year anniversary. Nucleic Acids Res 43(D1), D542-D548. doi:10.1093/nar/gku1181
Courtot M, Juty N, Knüpfer C, Waltemath D, Zhukova A, Dräger A, Dumontier M, Finney A, Golebiewski M, Hastings J, Hoops S, Keating S, Kell DB, Kerrien S, Lawson J, Lister A, Lu J, Machne R, Mendes P, Pocock M, Rodriguez N, Villeger A, Wilkinson DJ, Wimalaratne S, Laibe C, Hucka M, Le Novère N. Controlled vocabularies and semantics in Systems Biology. Mol Syst Biol 7, 543. doi:10.1038/msb.2011.77
Czauderna T, Klukas C, Schreiber F (2010) Editing, validating and translating of SBGN maps. Bioinformatics 26(18), 2340-2341. doi:10.1093/bioinformatics/btq407
Demir E, Cary MP, Paley S, Fukuda K, Lemer C, Vastrik I, Wu G, D’Eustachio P, Schaefer C, Luciano J, Schacherer F, Martinez-Flores I, Hu Z, Jimenez-Jacinto V, Joshi-Tope G, Kandasamy K, Lopez-Fuentes AC, Mi H, Pichler E, Rodchenkov I, Splendiani A, Tkachev S, Zucker J, Gopinathrao G, Rajasimha H, Ramakrishnan R, Shah I, Syed M, Anwar N, Babur O, Blinov M, Brauner E, Corwin D, Donaldson S, Gibbons F, Goldberg R, Hornbeck P, Luna A, Murray-Rust P, Neumann E, Ruebenacker O, Samwald M, van Iersel M, Wimalaratne S, Allen K, Braun B, Carrillo M, Cheung KH, Dahlquist K, Finney A, Gillespie M, Glass E, Gong L, Haw R, Honig M, Hubaut O, Kane D, Krupa S, Kutmon M, Leonard J, Marks D, Merberg D, Petri V, Pico A, Ravenscroft D, Ren L, Shah N, Sunshine M, Tang R, Whaley R, Letovksy S, Buetow KH, Rzhetsky A, Schachter V, Sobral BS, Dogrusoz U, McWeeney S, Aladjem M, Birney E, Collado-Vides J, Goto S, Hucka M, Le Novère N, Maltsev N, Pandey A, Thomas P, Wingender E, Karp PD, Sander C, Bader GD (2010) The BioPAX Community Standard for Pathway Data Sharing. Nat Biotechnol, 28, 935–942. doi:10.1038/nbt.1666
Funahashi A, Morohashi M, Kitano H, Tanimura N (2003) CellDesigner: a process diagram editor for gene-regulatory and biochemical networks. Biosilico 1 (5), 159-162
Gauges R, Rost U, Sahle S, Wegner K (2006) A model diagram layout extension for SBML. Bioinformatics 22(15), 1879-1885. doi:10.1093/bioinformatics/btl195
Gauges R, Rost U, Sahle S, Wengler K, Bergmann FT (2015) The Systems Biology Markup Language (SBML) Level 3 Package: Layout, Version 1 Core. J Integr Bioinform 12(2), 267. doi:10.2390/biecoll-jib-2015-267
Gonçalves E, van Iersel M, Saez-Rodriguez J (2013) CySBGN: A Cytoscape plug-in to integrate SBGN maps. BMC Bioinfo 14, 17. doi:10.1186/1471-2105-14-17
Hoops S, Sahle S, Gauges R, Lee C, Pahle J, Simus N, Singhal M, Xu L, Mendes P, Kummer U (2006) COPASI-a COmplex PAthway SImulator. Bioinformatics 22(24), 3067-3074. doi:10.1093/bioinformatics/btl485
Hucka M, Bolouri H, Finney A, Sauro HM, Doyle JC, Kitano H, Arkin AP, Bornstein BJ, Bray D, Cornish-Bowden A, Cuellar AA, Dronov S, Ginkel M, Gor V, Goryanin II, Hedley WJ, Hodgman TC, Hunter PJ, Juty NS, Kasberger JL, Kremling A, Kummer U, Le Novère N, Loew LM, Lucio D, Mendes P, Mjolsness ED, Nakayama Y, Nelson MR, Nielsen PF, Sakurada T, Schaff JC, Shapiro BE, Shimizu TS, Spence HD, Stelling J, Takahashi K, Tomita M, Wagner J, Wang J (2003) The Systems Biology Markup Language (SBML): A Medium for Representation and Exchange of Biochemical Network Models. Bioinformatics, 19, 524-531. doi:10.1093/bioinformatics/btg015
Hucka M, Nickerson DP, Bader G, Bergmann FT, Cooper J, Demir E, Garny A, Golebiewski M, Myers CJ, Schreiber F, Waltemath D, Le Novère N (2015) Promoting coordinated development of community-based information standards for modeling in biology: the COMBINE initiative. Frontiers Bioeng Biotechnol 3, 19. doi:10.3389/fbioe.2015.00019
Junker BH, Klukas C, Schreiber F (2006) VANTED: A system for advanced data analysis and visualization in the context of biological networks. BMC Bioinfo 7, 109. doi:10.1186/1471-2105-7-109
Sarah M Keating, Dagmar Waltemath, Matthias König, Fengkai Zhang, Andreas Dräger, Claudine Chaouiya, Frank T Bergmann, Andrew Finney, Colin S Gillespie, Tomáš Helikar, Stefan Hoops, Rahuman S Malik-Sheriff, Stuart L Moodie, Ion I Moraru, Chris J Myers, Aurélien Naldi, Brett G Olivier, Sven Sahle, James C Schaff, Lucian P Smith, Maciej J Swat,Denis Thieffry, Leandro Watanabe, Darren J Wilkinson, Michael L Blinov, Kimberly Begley, James R Faeder, Harold F Gómez, Thomas M Hamm, Yuichiro Inagaki, Wolfram Liebermeister, Allyson L Lister, Daniel Lucio, Eric Mjolsness, Carole J Proctor, Karthik Raman, Nicolas Rodriguez, Clifford A Shaffer, Bruce E Shapiro, Joerg Stelling, Neil Swainston, Naoki Tanimura, John Wagner, Martin Meier-Schellersheim, Herbert M Sauro, Bernhard Palsson, Hamid Bolouri, Hiroaki Kitano, Akira Funahashi, Henning Hermjakob, John C Doyle, Michael Hucka, and the SBML Level3Community members: Richard R Adams,Nicholas A Allen,Bastian R Angermann,Marco Antoniotti,Gary D Bader,Jan Červený,Mélanie Courtot,Chris D Cox,Piero Dalle Pezze,Emek Demir,William S Denney,Harish Dharuri,Julien Dorier,Dirk Drasdo,Ali Ebrahim,Johannes Eichner,Johan Elf,Lukas Endler,Chris T Evelo,Christoph Flamm,Ronan MT Fleming,Martina Fröhlich,Mihai Glont,Emanuel Gonçalves,Martin Golebiewski,Hovakim Grabski,Alex Gutteridge,Damon Hachmeister,Leonard A Harris,Benjamin D Heavner,Ron Henkel,William S Hlavacek,Bin Hu,Daniel R Hyduke,Hidde Jong,Nick Juty,Peter D Karp,Jonathan R Karr,Douglas B Kell,Roland Keller,Ilya Kiselev,Steffen Klamt,Edda Klipp,Christian Knüpfer,Fedor Kolpakov,Falko Krause,Martina Kutmon,Camille Laibe,Conor Lawless,Lu Li,Leslie M Loew,Rainer Machne,Yukiko Matsuoka,Pedro Mendes,Huaiyu Mi,Florian Mittag,Pedro T Monteiro,Kedar Nath Natarajan,Poul MF Nielsen,Tramy Nguyen,Alida Palmisano,Jean-Baptiste Pettit,Thomas Pfau,Robert D Phair,Tomas Radivoyevitch,Johann M Rohwer,Oliver A Ruebenacker,Julio Saez-Rodriguez,Martin Scharm,Henning Schmidt,Falk Schreiber,Michael Schubert,Roman Schulte,Stuart C Sealfon,Kieran Smallbone,Sylvain Soliman,Melanie I Stefan,Devin P Sullivan,Koichi Takahashi,Bas Teusink,David Tolnay,Ibrahim Vazirabad,Axel Kamp,Ulrike Wittig,Clemens Wrzodek,Finja Wrzodek,Ioannis Xenarios,Anna Zhukova andJeremy Zucker (2020) SBML Level 3: an extensible format for the exchange and reuse of biological models. Mol Syst Biol 16, e9110. doi:10.15252/msb.20199110
Kholodenko BN (2000) Negative feedback and ultrasensitivity can bring about oscillations in the mitogen-activated protein kinase cascades. Eur J Biochem.267(6), 1583-1588. doi:10.1046/j.1432-1327.2000.01197.x
Kitano H (2003) A graphical notation for biochemical networks. Biosilico 1 (5), 169-176. doi:10.1016/S1478-5382(03)02380-1
Le Novère N, Hucka M, Mi H, Moodie S, Shreiber F, Sorokin A, Demir E, Wegner K, Aladjem M, Wimalaratne S, Bergman FT, Gauges R, Ghazal P, Kawaji H, Li L, Matsuoka Y, Villéger A, Boyd SE, Calzone L, Courtot M, Dogrusoz U, Freeman T, Funahashi A, Ghosh S, Jouraku A, Kim S, Kolpakov F, Luna A, Sahle S, Schmidt E, Watterson S, Goryanin I, Kell DB, Sander C, Sauro H, Snoep JL, Kohn K, Kitano H (2009) The Systems Biology Graphical Notation. Nat Biotechnol 27, 735-741. doi:10.1038/nbt.1558
Shannon P, Markiel A, Ozier O, Baliga NS, Wang JT, Ramge D, Amin N, Schwikowski B, Ideker T (2003) Cytoscape: a software environment for integrated models of biomolecular interaction networks. Bioinformatics 13, 2498-2504. doi:10.1101/gr.1239303
van Iersel MP, Villéger AC, Czauderna T, Boyd SE, Bergmann FT, Luna A, Demir E, Sorokin A, Dogrusoz U, Matsuoka Y, Funahashi A, Aladjem MI, Mi H, Moodie SL, Kitano H, Le Novère N, Schreiber F (2012) Software support for SBGN maps: SBGN-ML and LibSBGN. Bioinformatics 28, 2016-2021. doi:10.1093/bioinformatics/bts270