By Nicolas Gambardella
The latest statistics from Israel and the UK on COVID-19 in vaccinated and unvaccinated populations are getting viral. One of the main reasons for this success in some circles is that they apparently show that the vaccines against the COVID-19 virus are no longer effective! This is, of course, not the case. While the circulating antibodies triggered by a vaccination course seem to decline with a half-life of about six months, the protection remains very strong against disease, mild or severe. The protection against infection is also still robust during the first months after vaccination, whatever the variant. What could then explain the apparent paradoxical result that people die from COVID-19 as frequently in vaccinated populations as in unvaccinated ones? Several factors might be involved. For instance, in most datasets used to compute effectiveness, unvaccinated pre-infected people are not removed. However, today I would like to highlight another reason because I think it is a trap in which casual data analysts fall very frequently: The Simpson’s paradox.
The Simpson’s paradox is a situation where a trend present in several subpopulations disappears or even reverts when all those populations are pulled together. This is often due to hidden confounding variables. The situation is well illustrated in the following figure obtained from Wikimedia commons. While the correlation between Y and X is positive in each of the five subpopulations, this correlation becomes negative if we do not distinguish the subpopulations.
What about the vaccination against SARS-CoV-2? Jeffrey Morris explains on his blog the impact of Simpson’s paradox on the analysis of Israel data in a precise and enlighting manner, way better than I could. However, his excellent explanation is relatively long and detailed. So I thought I could give a short version here, with an imaginary, simplified, albeit realistic population.
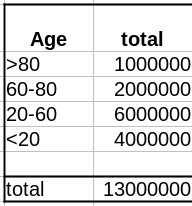
As discussed in a past post, the crucial data here is the age structure of the population. To simplify, we’ll take a pretty simple age pyramid, close to what we observe in developed countries, i.e., homogenous with only a decrease on top, here 1 million people per decade, and 1 million for everyone over 80.
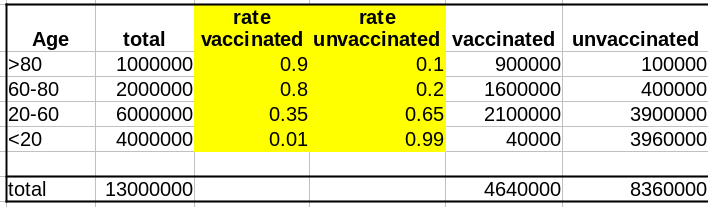
The first important variable is the rate of vaccination. Because vaccination campaigns started with the elderly populations, and that vaccine hesitancy strongly decreases with age, the vaccination rate is much lower in younger populations.
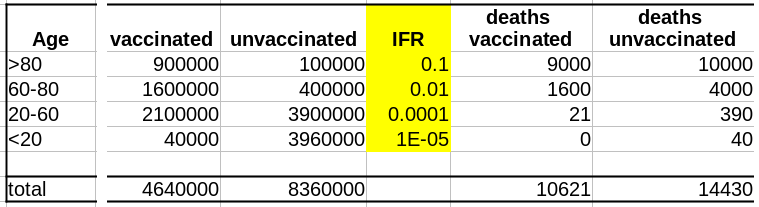
The second important variable is the disease’s lethality – the Infection Fatality Rate – for each age group. Here as well, the IFR is much lower in the younger group. And here lies the crux of the problem: rate of vaccination and IFR are not independent variables; both are linked to age.
Let’s assume that our vaccine has an absolute efficacy of 90%, and for simplicity, this efficacy does not change with age. The number of deaths in the unvaccinated population is:
Deaths unvaccinated = round(unvaccinated * IFR)
The “round” function is to avoid half-dead people. The number of deaths in the vaccinated population is:
Deaths vaccinated = round(vaccinated * IFR * 0.1)
where 0.1 = (100 – efficacy)/100
Now that we have the number of deaths in each of our populations, vaccinated or not, we can calculate the death rates, i.e. deaths/population, and compute the efficacy as:
(death rate unvaccinated – death rate vaccinated)/(death rate unvaccinated)*100
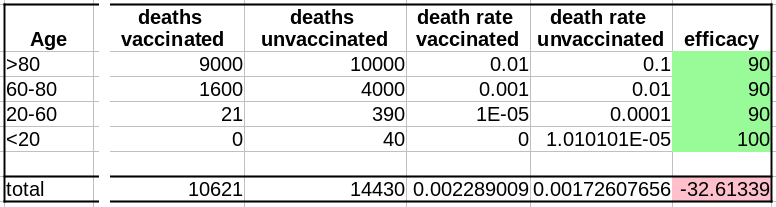
Unsurprisingly, the efficacy for all age groups is 90%. The 100% for the <20 comes from the fact that 0.04 death is 0.
HOWEVER, if we merge all the age groups together, the efficacy completely disappears! Not only that, it seems that the vaccine actually increases the death rate!!! Being unvaccinated presents an efficacy of 32% against death!
This is of course an artefact (we know that; we created the dataset with an actual vaccine efficacy of 90%!). This example used vaccine efficacy. However, Simpson’s paradox is awaiting the casual data analyst behind any corner. Confounding variables must be tracked down before doing any statistical analysis, and populations must be stratified accordingly.