By Nicolas Gambardella
How many times are we seeing the following comment on social media those days: “Most covid-19 cases are now in vaccinated people. This is the proof that vaccines don’t work”.
Not quite.
It all depends on the relative populations of vaccinated versus unvaccinated. In a previous post, I presented a summary of vaccine effectiveness on different SARS-CoV-2 variants. Each figure represented the global effectiveness. However, vaccination rates depend on age since most countries started to vaccinate the elderly first. So let’s see if we can be more precise.
Public Health England recently published its latest SARS-CoV-2 variants of concern and variants under investigation in England. It contains the details of infections by identified variants in vaccinated and unvaccinated people. Let’s focus on the Delta variant.
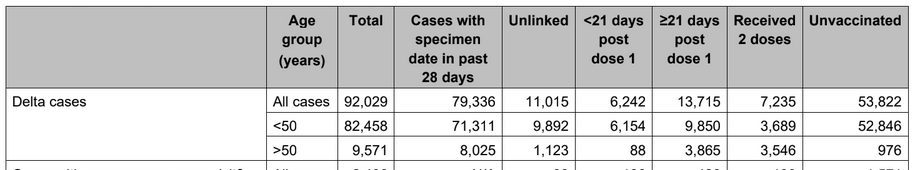
Whaaaat? In people over 50 years of age, 0nly 976 cases in unvaccinated, while 3953 people with one dose and 3546 fully vaccinated people were infected! Surely this vaccine does not offer any protection, right?
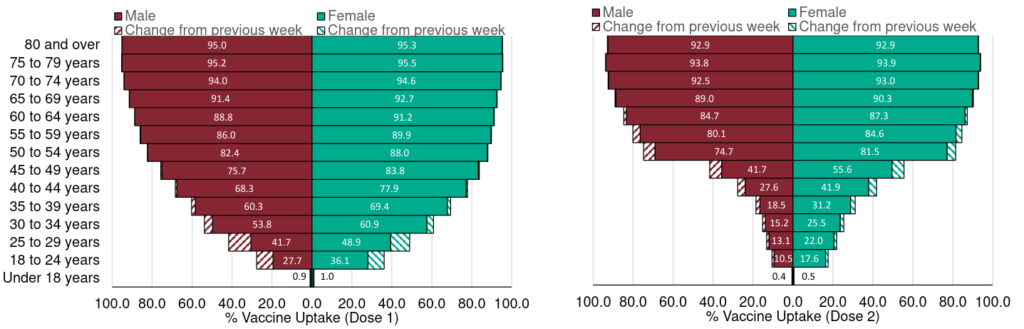
Let’s see if we can compute the vaccine effectiveness, shall we? For that, we need first the vaccination rate per age. Fortunately, this is published by Public Health England every week. Since the table about report cases up to June 21, we will use the vaccinations data published on June 24, including vaccinations up to June 20. Of course, not all the Delta cases have appeared on June 20. However, most of them have appeared in the past few months. Moreover, administration of the 2nd dose has plateaued for the elderly population.
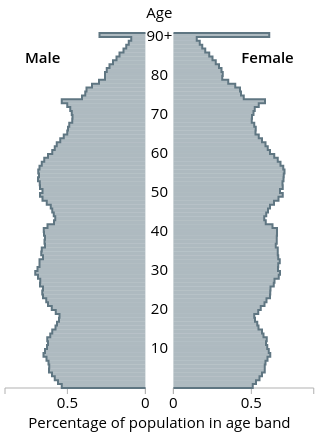
Then, we need to know how many people belong to each of those age groups. For that, we can use the 2020 population predicted by the Office for National Statistics based on the 2018 figure (the age pyramid shows percentages for each year, but we can download actual numbers for each 5-years age group).
We can now compute for each age group how many people had two doses, only one dose, or are still unvaccinated (I sum up males and females).
| Age | 1 dose | 2 doses | unvaccinated |
| 0-17 | 56230 | 56584 | 14033150 |
| 18-24 | 605991 | 726010 | 4318151 |
| 25-29 | 837303 | 728416 | 2924493 |
| 30-34 | 1587417 | 847650 | 2100138 |
| 35-39 | 1786373 | 1003080 | 1628239 |
| 40-44 | 1702290 | 1268632 | 1127652 |
| 45-49 | 1583028 | 1838131 | 890384 |
| 50-54 | 548632 | 3378858 | 690501 |
| 55-59 | 396658 | 3567857 | 549185 |
| 60-64 | 202651 | 3272462 | 387171 |
| 65-69 | 95785 | 2998587 | 268383 |
| 70-74 | 59031 | 3118291 | 191577 |
| 75-79 | 41180 | 2259096 | 111907 |
| 80+ | 84457 | 3159787 | 164372 |
| total | 9587027 | 28223441 | 29385301 |
These numbers show 24118034 people over 50, 21754937 with two doses and 2363096 unvaccinated, tenfold more fully vaccinated! Thus, the 3546 and 976 cases represent 0.0163% and 0.0413% of the respective populations. In other words, the full vaccination offers 60.5% protection against the Delta variant.
The same calculation on under-50 shows even better protection at 70.8% (This, again, shows that we must vaccinate young people if we want to protect the older ones and get rid of this virus.
The better the vaccine coverage, the more cases will be observed in the vaccinated population. This does not mean the vaccine is not effective!