Depuis le développement des premiers vaccins contre le SARS-CoV-2, j’ai collectionné les données sur leur efficacité. Cette efficacité est continuellement remise en cause par l’apparition de virus variants, c’est-à-dire de nouvelles souches porteuses d’un groupe caractéristique de mutations. Avec autant de vaccins et autant de variants, il devient difficile de rester à jour. Ce problème est aggravé par l’abondance de publications présentant des types d’évaluations différents. Ainsi, bien qu’il soit très important de garder trace de toutes les valeurs et de leurs intervalles de confiance, j’ai pensé qu’il serait bon d’avoir une vue d’ensemble simplifiée de la situation actuelle.
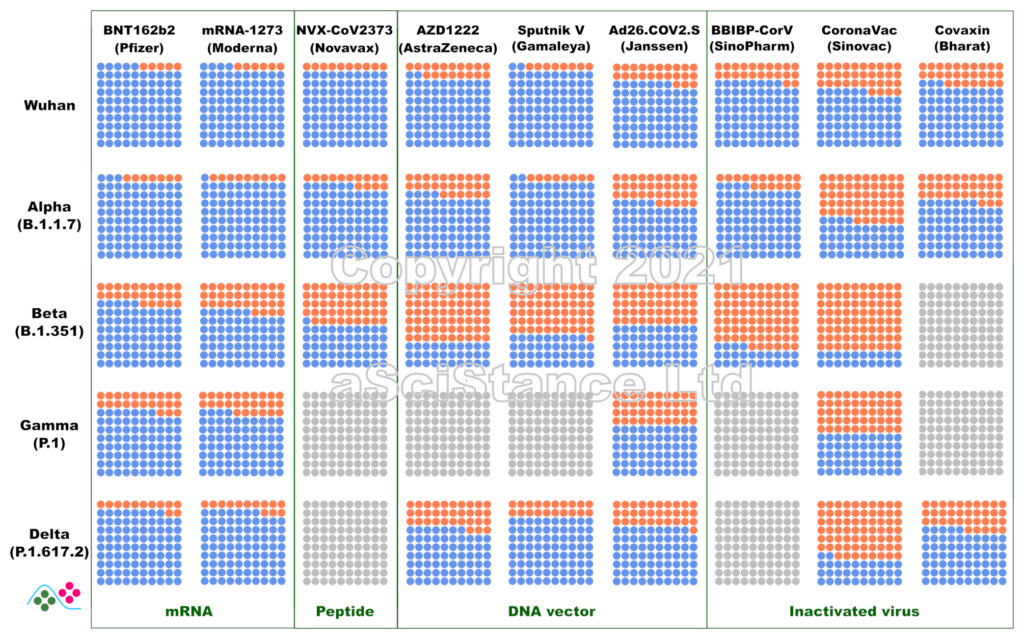
La figure ci-dessous représente l’efficacité globale des principaux vaccins contre les principaux variants sous forme de pourcentages visuels. Les points bleus représentent les personnes protégées qui auraient été infectées sans vaccination. Les points gris représentent les paires {vaccin, variant} pour lesquelles on ne dispose pas de suffisamment de données. Ces nombres représentent la protection contre l’infection, et non la protection contre la maladie ou le décès (pour lesquels la protection est probablement plus élevée). De plus, ils sont obtenus après le protocole de dosage recommandé pour chaque vaccin. NB: Dans certains cas, « Wuhan » signifie « aucun des variants ci-dessous ».
Ces données sont les estimations les meilleures et les plus fiables au moment où j’écris ce billet (mise à jour le 12 novembre 2021). J’ai privilégié les données de vie réelle aux essais cliniques, l’efficacité directement mesurée à l’efficacité déduite des tests de neutralisation (où le sérum de personnes vaccinées est utilisé in vitro sur des virus ou des protéines recombinantes), et les données indépendantes aux données fournies par les fabricants de vaccins. J’ai omis certains vaccins autorisés en raison de la rareté des données (et de leur faible utilisation). Certaines des données utilisées pour faire la figure sont connues pour leur « particularité » et ont fait l’objet de critiques. Cependant, il n’existe rien de mieux. Espérons que ces graphiques deviendront plus précis à mesure que d’autres études seront publiées.
Since the development of the first vaccines against SARS-CoV-2, I have gathered data about their efficacy. Unfortunately, this efficacy is continuously challenged by the appearance of variant viruses, i.e., novel strains carrying a bunch of mutations. With so many vaccines and so many variants, it becomes difficult to keep track of the data. This is compounded by the abundance of publications presenting different types of evaluations. So, while keeping track of all the values and their confidence intervals is very important, I thought it would be nice to have a single overview of where we stand.
The figure below represents the overall efficacy of the main vaccines for the main variants as visual percentages. The blue dots represent protected people who would have been infected without the vaccines. Grey dots represent pair {vaccine, variant} for which not enough data is available. This figure represents the protection from infection, not the protection from disease or death (which are likely higher). The figures are those achieved after the recommended dosing protocol for each vaccine. NB: in some plots, “Wuhan” means “none of the variants listed below”.
These numbers are the best and most reliable estimates as I write this post (updated 02 October 2021). I privileged real world data over clinical trials, directly measured efficacy over efficacy inferred from neutralisation assays (where the serum of vaccinated individuals is used in vitro with viruses or recombinant proteins), and independent data over data provided by vaccine manufacturers. I omitted some authorised vaccines because of data scarcity (and low usage). Some of the data used to plot the graph are known to present peculiarities and raised issues. However, nothing better is available. Hopefully, these plots will become more accurate as more studies are published.
Abordons aujourd’hui une question d’actualité, et qui me tient à cœur, ce que l’on appelle en anglais « evidence-based medicine ». Comment traduire cette expression en français ?
Tout d’abord de quoi parlons-nous ? Depuis des temps immémoriaux, la médecine est un art, et les médecins sont des artisans. Autrement dit, après une formation initiale auprès de mentors, le médecin peaufine ses connaissances et sa réflexion sur la base de son expérience professionnelle. Cette approche présente des inconvénients qu’il n’est pas besoin de développer. Cet état de chose a commencé à évoluer au XIXe siècle avec la « médecine expérimentale » de Claude Bernard, puis au XXe avec l’arrivée de la pharmacologie moléculaire et de l’accélération des connaissances en biologie humaine. La transition de la médecine d’un art en une science s’est parachevée il y a un demi-siècle avec la généralisation des essais cliniques contrôlés, où l’on tâche d’éliminer l’arbitraire personnel et d’évaluer la validité des observations en utilisant des statistiques, souvent sophistiquées. L’avènement récent des données moléculaires à haut débit a ajouté à cet « evidence-based medicine » un aspect de précision et de personnalisation.
Ce qui nous amène à l’utilisation d’un faux ami. « Evidence » est le mot utilisé dans les tribunaux anglo-saxons équivalent au mot français « preuve ». En revanche, en science, « preuve » se dit « proof ». Cette dernière acception est beaucoup plus forte que la précédente (on pourrait du reste discuter longuement sur la différence de statut des « preuves » dans les tribunaux francophones et des « evidences » dans les tribunaux anglo-saxons). Andrew Wiles a fourni la preuve de la conjecture de Fermat (qui devrait donc s’appeler Théorème de Wiles…). Ce théorème de Fermat est toujours vrai. Pour des entiers strictement positifs x, y, z, il n’existe aucun n>2 tel que x2+y2=z2. Ce résultat est vrai, et le restera toujours.
En revanche, les résultats d’une expérience biologique ou d’un essai clinique nous renvoient une image beaucoup plus nuancée. Tout d’abord, les résultats sont associés à un niveau de confiance. Si la valeur p est de 0,05 (une valeur souvent utilisée en statistique médicale), cela veut dire qu’il y a 5 % de chances que le résultat soit dû au hasard (C’est un peu plus compliqué que ça, mais ce n’est pas le sujet du billet). De plus, des résultats différents pourraient être obtenus avec une autre cohorte, présentant d’autres caractéristiques, soit évidentes (âge, sexe, état de santé) soit plus subtiles (une proportion différente d’haplotypes clés entre les groupes témoins et traités). D’où l’existence des méta-analyses, qui permettent de réconcilier plusieurs essais cliniques.
Le résultat d’un essai clinique est très respectable et doit être une référence en l’absence d’information contraire (et de situations particulières comme les circonstances du patient, la disponibilité et le prix des traitements, etc.). Mais ce n’est pas une « preuve ». Je m’insurge donc contre la traduction de « evidence-based medicine » en « médecine fondée sur les preuves », bien qu’elle soit la plus utilisée. C’est selon moi un mauvais anglicisme.
Puisque nous en sommes au chapitre des anglicismes, évacuons de suite le « basé sur ». L’académie française nous dit :
« On s’accorde aujourd’hui pour employer Baser sur dans le domaine militaire et l’y réserver : Des troupes ont été basées sur la frontière. On évitera donc l’emploi figuré, transposition de l’anglais based on, qui s’est abusivement répandu, et on lui préfèrera des synonymes comme Fonder, Établir ou Asseoir. »
Comment dès lors traduire « evidence »? On pourrait, comme Wikipedia, utiliser l’aspect factuel du résultat, et utiliser « médecine fondée sur les faits ». Mais là encore, on confond le résultat et la conclusion. Le résultat de l’essai clinique, qu’un traitement administré selon un certain schéma thérapeutique à une cohorte donnée a probablement entraîné avec une probabilité supérieure à 0,95 une amélioration en moyenne de X %, 95 % des mesures se trouvant dans un intervalle donné autour de X, est un fait. La conclusion, à savoir que le traitement entraîne une amélioration de X % n’en est pas un.
À « fait », je préférerais donc « données », qui est… de fait (sic) le nom le plus utilisé après « preuve ». Au final, le praticien utilisera ces données, en conjonction avec les données venant d’autres essais, de surveillances longitudinales (cohortes ou expérience personnelle), des circonstances du patient, des circonstances géographiques, temporelles, et financière pour décider de la marche à suivre.
Et point n’est besoin de rajouter un adjectif pour ré-introduire la preuve par la petite porte comme on voit souvent avec « médecine fondée sur les données probantes ». Et si par « données probantes » on entend juste des données auxquelles on peut se fier, on tombe dans la tautologie. Si une donnée n’est pas fiable, pourquoi la prendre en compte ?
Evidence-based medicine = Médecine fondée sur les données
In some domains, the most challenging part of language translation (in a broad sense) is the translation itself (in a narrow sense), i.e., converting the words from one language to the other while accurately conveying the meaning and the tone of the original document. In the scientific and technical domains, this is not always the case. It is not unfrequent that most of the time I spend on a text is, in fact, devoted to understanding the source in English.
The main reason is that many of those documents are not written by domain specialists proficient in the good William’s language (Shakespeare, not The Conqueror). Most people working in highly technical domains, such as biomedical and pharmaceutical, have been reading, writing, and speaking English for many years. They have produced research publications, technical reports, grant applications, and lectures for international audiences. Communicating with others in English has never been a problem. When times come to write a brochure, a presentation for HCPs or patients, or a website, they naturally assume their usual English level is sufficient. Rather than spending time speaking with a professional writer, who would struggle to understand the technical subtleties and cost money, isn’t it quicker to do the job yourself? After all, who knows better than yourself what you want to say?
I think this is true. The initial raw material should come from the horse’s mouth. However, we should all be acutely aware that being able to converse with our colleagues is rarely sufficient when producing patient- or consumer-ready documents. During a conversation, half the meaning is conveyed through body language, visual support, and implicit shared knowledge. Your English colleague knows what you truly mean when you use those dozens of anglicised French words (replace by your own native language). They might even find that charming. Much less charming will it be for a potential client or your poor translator. The former might be put off by what could be perceived as a lack of professionalism. The latter might mistranslate your document, with potentially dire consequences.
I recently finished reviewing a medical marketing brochure for a foreign company. Many sentences were grammatically incorrect, to the point of becoming meaningless. Most sentences were convoluted, too long, repetitive. The paragraphs were heavy and hard to read. A significant amount of words were slightly off, definitely not what a native English marketing brochure would have used (or any native text for that matter). Finally, the formatting was completely inconsistent (e.g., usage of capitals or abbreviations).
I do not think this brochure reflected well on an otherwise excellent company. I believe that if the foreign person who wrote the English text had taken the time to reverse-translate it with a tool like DeepL, they would have been horrified to see that the result was not at all what they intended. I hope the French translation will alleviate some of the issues. I also provided a complimentary list of suggestions for the English version, as I often do when translating such documents.
We should always ask someone else to edit and proofread our texts. If possible, this should be someone with no in-depth knowledge of the subject. Ideally, the pipeline would comprise several verification layers, possibly combined in fewer individuals or, on the contrary, repeated with several people:
Verification of the technical content. Are you even using the correct English words?
Marketing and localisation. The US is not the UK. Patients are not HCPs. HCPs are not researchers.
Proofreading. Itself with three subcategories: language correctness (grammar, punctuation, and spelling); elegance and fluidity; terminology and visual consistency throughout the document(s).
Now, to finish on a lighter note, some language-specific advice for scientists:
Starting, of course, by the Frenchs. My dear fellow countrymen, the fact that English and French share the same sentence structure does not mean you can replace the words one by one and keep the French term if you do not know the English equivalent.
It would be best if Italians gave a subject to all verbs, who feel lonely otherwise.
As bothersome as it seems, Russians must use articles in front of nouns, at least from time to time.
Chinese should realise that spelling in Latin is as essential as the correct stroke inHànzì. Vowels are not interchangeable.
While the pursuit of accuracy is laudable, German writing in English should seek to limit the number of words in their sentence to double digits.
To finish, I would love to hear all your comments, corrections, and criticisms regarding this post.
A crucial part of any computational modelling is getting parameter values right. By computational model, I mean a mathematical description of a set of processes that we can then numerically simulate to reproduce or predict a system’s behaviour. There are many other kinds of computational or mathematical models used in computational biology, such as 3D models of macromolecules, statistical models, machine learning models and more. While some concepts dealt with in this blog post would actually be relevant, I want to limit the scope of this post to what is sometimes called “systems biology” models.
So, we have a model that describes chemical reactions (for instance). The model behaviour will dictate the values of some variables, e.g. substrate or product concentrations. We call those variables “dependent” (“independent variables” are variables whose values are decided before any numerical simulation or whose values do not depend on the mathematical model, such as “time” for standard chemical kinetics model). Another essential set of values that we have to fix before a simulation consists of the initial conditions, such as initial concentrations.
The quickest way to get cracking is to gather the variable values from previous models (found for instance in BioModels), from databases of biochemical parameters such as Brenda or SABIO-RK, or from patiently sieving scientific literature. But what if we want to improve the values of the variables? This blog post will explore a few possible ways forward using the modelling software tool COPASI, namely, sensitivity analysis, picking up variable values and looking at the results, parameter scans, optimisation, and parameter estimation.
Loading a model in COPASI
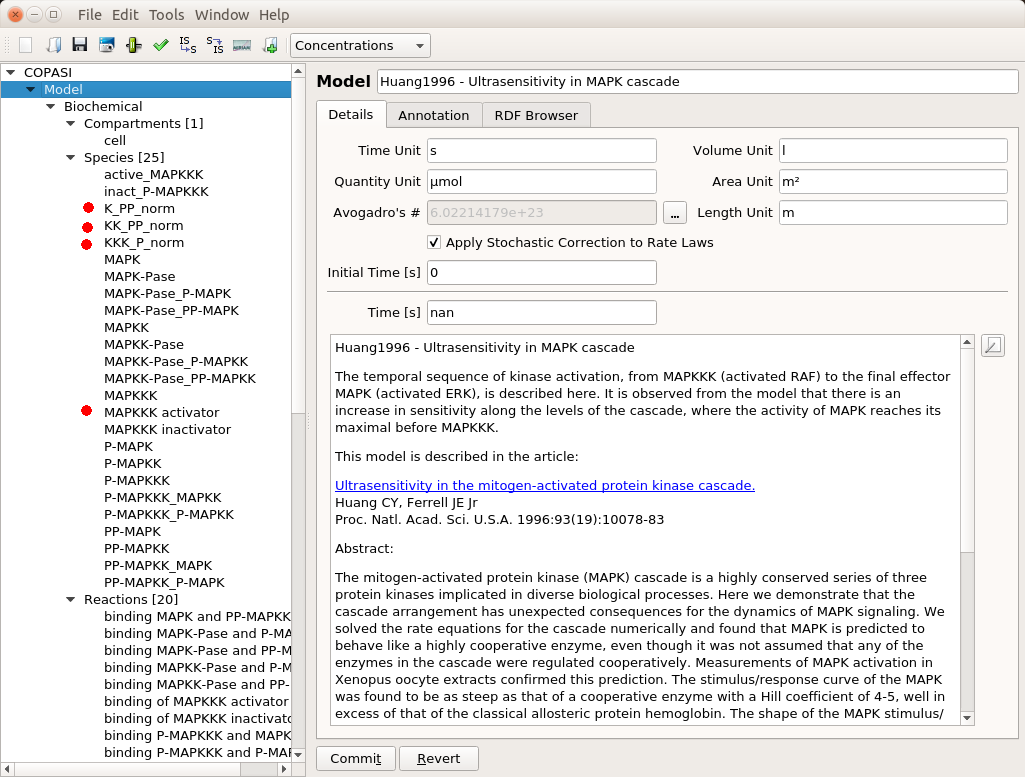
First, we need to have a model to play with. The post will use the model of MAPK signalling published by Huang and Ferrell in 1996. You can find it in BioModels where can download the SBML version and import it in COPASI. Throughout this post, I will assume the reader masters the basic usage of COPASI (create reactions, run simple simulations, etc.). You will find some introductory videos about this user-friendly, versatile, and powerful tool on their website.
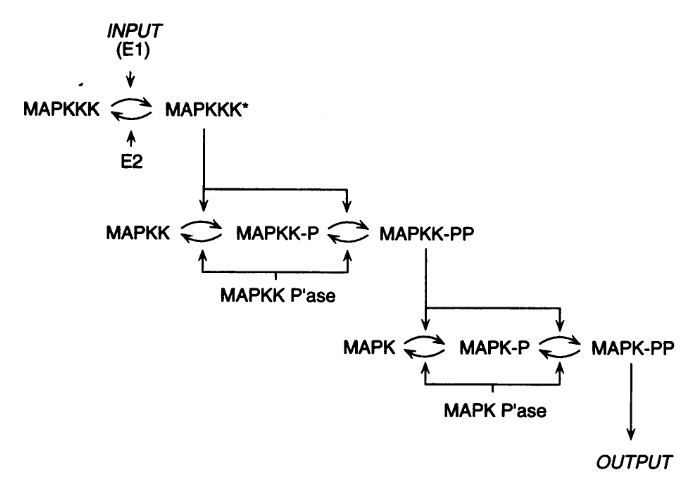
The model presents the three-level cascade activating MAP kinase. MAPK, MAPKK, and MAPKKK mean Mitogen-activated protein kinase, Mitogen-activated protein kinase kinase, and Mitogen-activated protein kinase kinase kinase, respectively. Each curved arrow below represents three elementary reactions: binding and unbinding of the protein to an enzyme, and catalysis (addition or removal of a phosphate).
The top input E1 (above) is called MAPKKK activator in the model. To visualise the results, we will follow the normalised values for the active (phosphorylated) forms of the enzymes K_PP_norm, KK_PP_norm and K_P_norm, that are just the sums of all the molecular species containing the active forms divided by the sums of all the molecular species containing the enzymes (NB: Throughout the screenshots, the red dots are added by myself and not part of COPASI’s GUI).
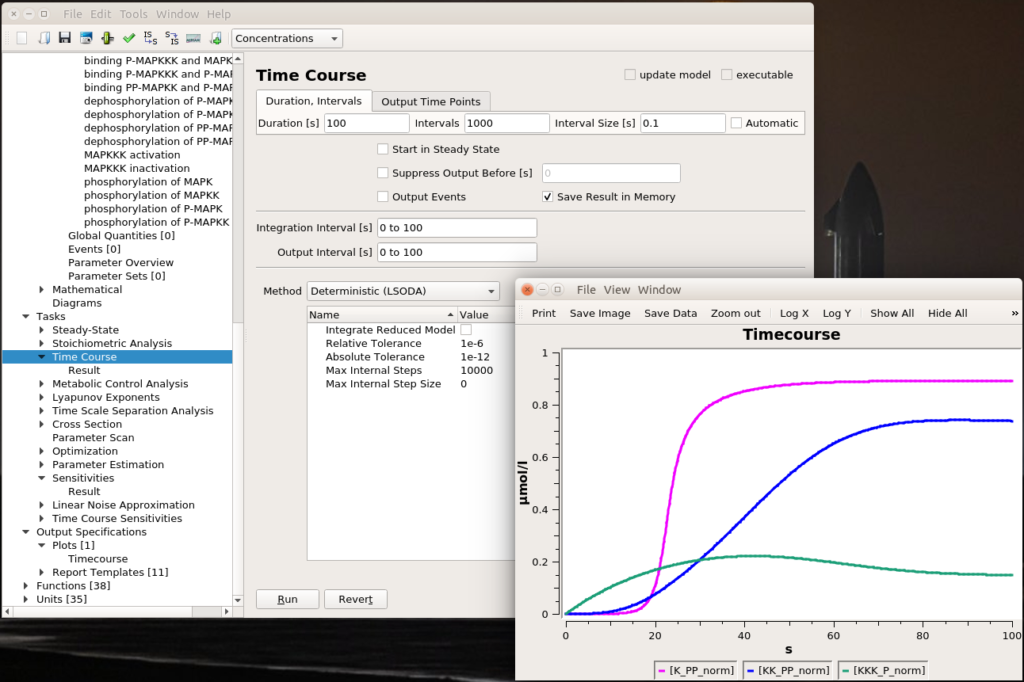
Let’s run a numerical simulation of the model. Below you see the activation of the three enzymes, with the swift and supra-linear activation of the bottom one, MAPK, one of the hallmarks of the cascade (the others being an amplification of the signal and an ultrasensitive dose-response which allows to fully activate MAPK with only a touch of MAPKKK activation).
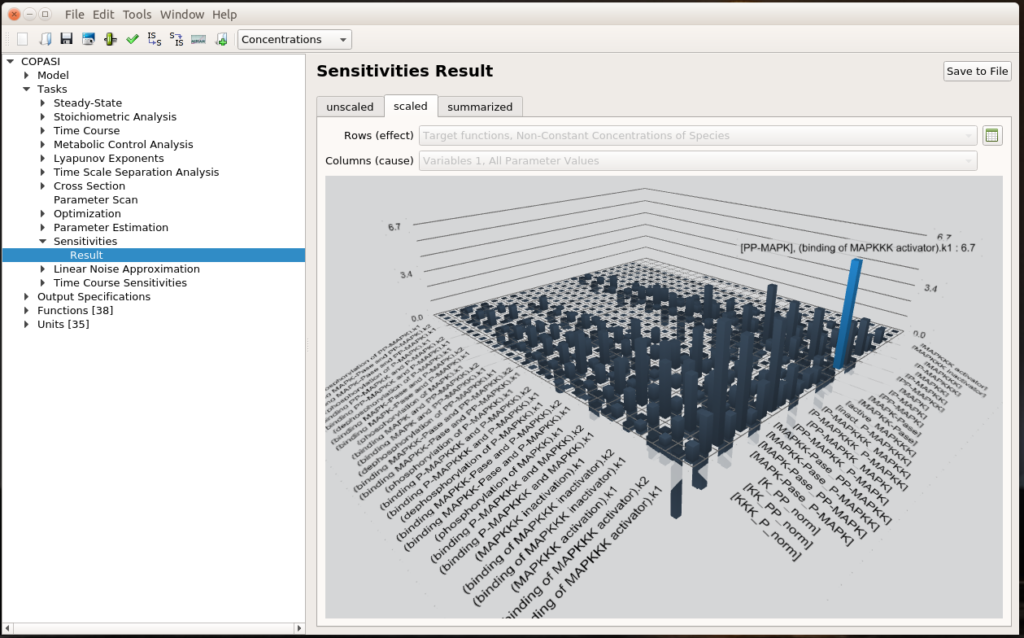
Sensitivity analysis
The first question we can ask ourselves is “What are the parameters that values affect the most the output of our system?”. To do so, we can run a sensitivity analysis. COPASI will vary a bit all the parameters and measure the consequences of these changes on the results of a selected task, here the steady-state of the non-constant concentrations of species.
We see that the most important effect is the impact of MAPKKK activator binding constant (k1) on the concentration of PP-MAPK, which happens to be the final output of the signalling cascade. This is quite relevant since the MAPKKK activator binding constant basically transmits the initial signal at the top of the cascade. You can click the small spreadsheet icon on the right to access coloured matrices of numerical results.
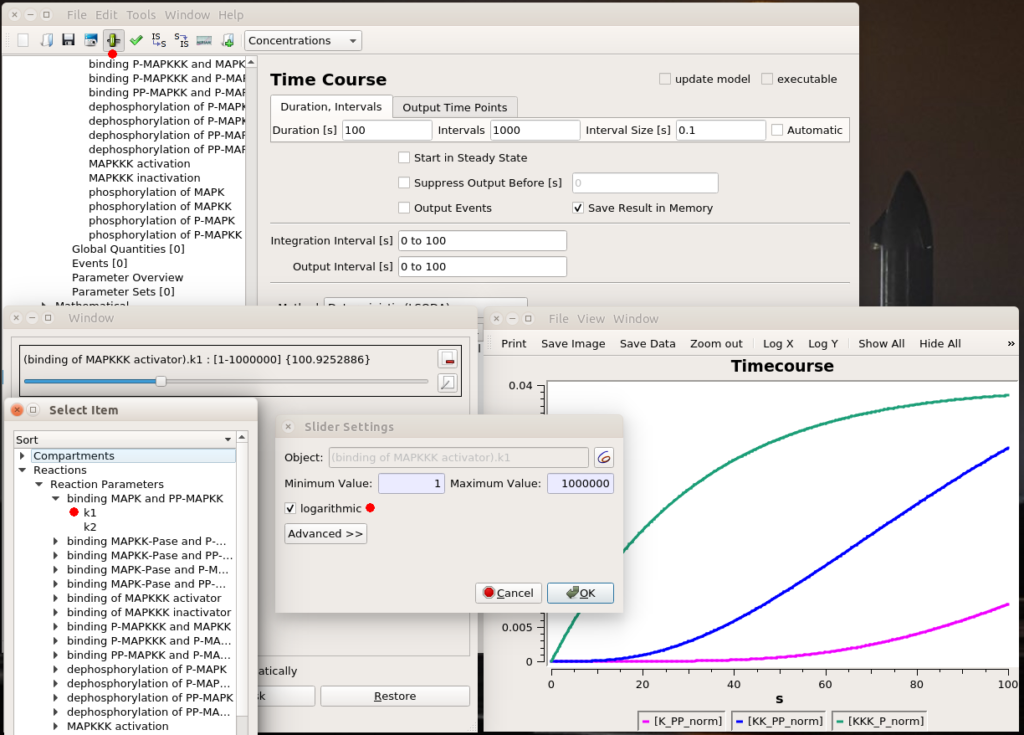
Testing values
All right, now we know which parameter we want to fiddle with. The first thing we can do is visually look at the effect of modifying the value. We can do that interactively with a “slider“. Once in the timecourse panel, click on the slider icon in the toolbar. You can then create as many sliders as you want to set values manually. Here, I created a slider that can vary logarithmically (advised for most model parameters) between 1 and 1 million. The initial value, used to create the timecourse above, was 1000. We see that sliding to 100 changes the model’s behaviour quite dramatically, with very low enzyme activations. Moving it well above 1000 will show that we increase the speed of activation of the three enzymes, increase the activation of the top enzyme, albeit without significant gain on K-PP, our interesting output.
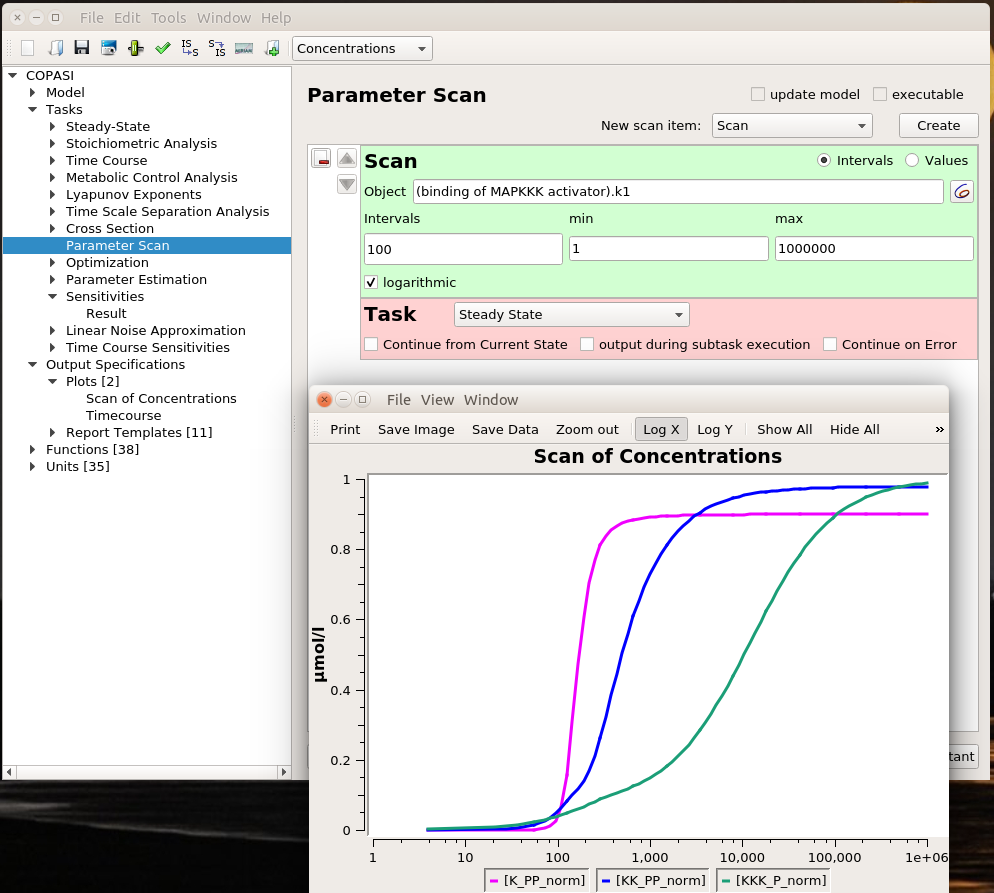
Parameter scans
Playing with sliders is great fun. But this is not very precise. And if we want to evaluate the effect of changing several parameters simultaneously, this can be extremely tedious. However, we can do that automatically thanks to COPASI’s parameter scans. We can actually repeat the simulation with the same value (useful to repeat stochastic simulations), systematically scan parameter values within a range, or sampling them from statistical distributions (and nest all of these). Below, I run a scan over the range defined above and observe the same effect. To visualise the scan’s results, I created a graph that plotted the active enzyme’s steady-state versus the activator binding constant.
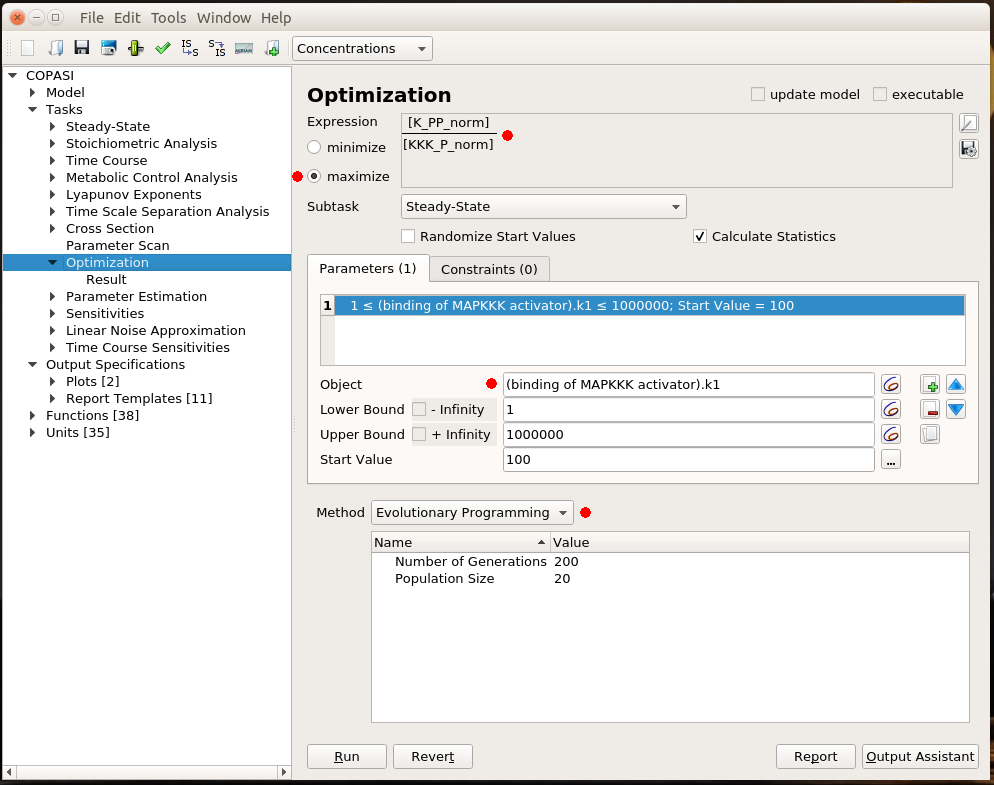
Optimisation
All that is good, but I still have to look at curves or numerical results to find out the best value for my parameter. Ideally, I would like COPASI to hand me directly the value. This is the role of optimisation. Optimisation if made up of two parts: the result I want to optimise and the parameter to change to optimise it. I will not discuss the possibility to optimise a value. There are many cases for which optimisation is just not possible. For instance, it is not possible to optimise the production of phosphorylated MAPK. Whatever upper bound we would fix for the activator binding constant, the optimal value would end up on this boundary. In this example, I decided to maximise the steady-state concentration of K_PP for a given concentration of KKK_P, i.e. getting the most bang for my buck. As before, the parameter I want to explore is the MAPKKK activator binding constant. I fix the same lower and upper bound as before. COPASI offers many algorithms to explore parameter values. Here, I chose Evolutionary Programming, which offers a good balance between accuracy and speed.
The optimal result is 231. Indeed, if we look at the parameter scan plot, we can see that with a binding constant of 231, we get an almost maximal activation of MAPK with minimal activation of MAPKKK. Why is this important? All those enzymes are highly connected and will act on downstream targets right, left, and centre. In order to minimise side effects, I want to activate (or inhibit) protein as little as necessary. Being efficient at low doses also helps with suboptimal bioavailability. And of course, using 100 times less of the stuff to get the same effect is certainly cheaper, particularly for biologics such as antibodies.
Parameter estimation
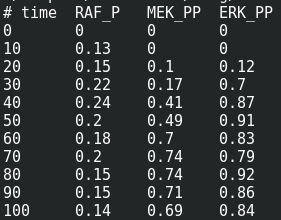
We are now reaching the holy grail of parameter search, which is parameter estimation from observed results. As with optimisation, this is not always possible. It is known as the identifiability problem. Using the initial model, I created a fake noisy set of measurements, which would, for instance, represent the results of Western blot or ELISA using antibodies against phosphorylated and total forms of RAF, MEF, and ERK, which are specific MAPKKK, MAPKK, and MAPK.
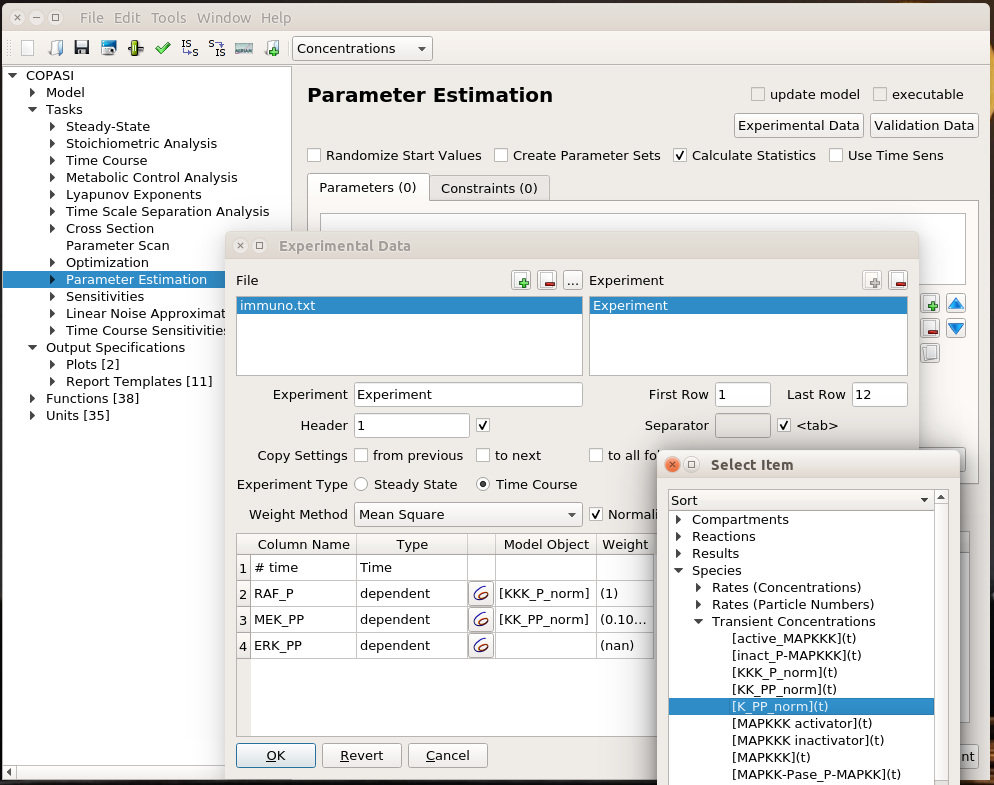
I can load this file (immuno.txt on the screenshot) in COPASI, and map the experimental values (automatically recognised by COPASI) to variables of the model. Note that we can load several files, and each file can contain several experiments.
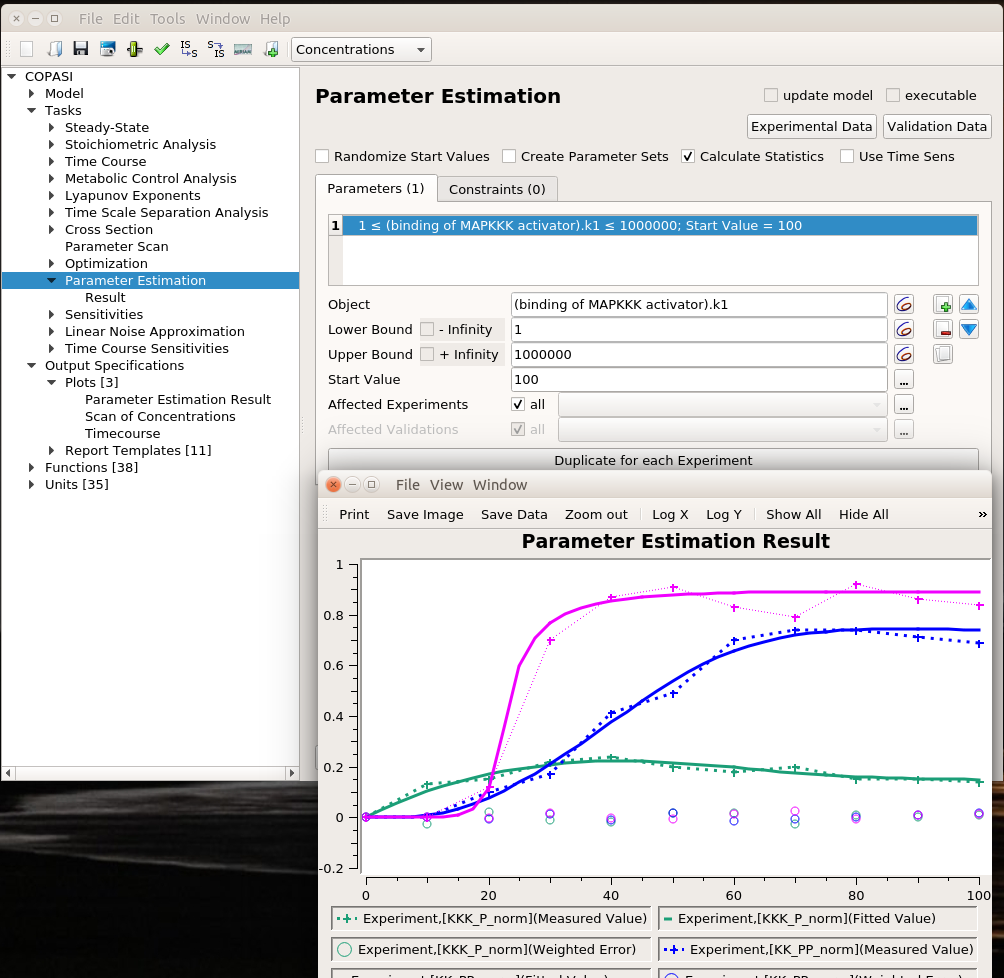
I can then list the parameters I want to explore, here the usual activator binding constant, between 1 and 1 million. Note that we can use only some of the experiments in the estimation of given parameters. This allows building extremely powerful and flexible parameter estimations.
We can use the same algorithms used in optimisation to explore the parameter space. The plot represents the best solution. Dashed lines link experimental values, continuous lines represent the fitting values, and circles are the error values.
The value estimated by COPASI for the binding constant is 1009. The “experiment” was created with a value of 1000. Not bad.
This concludes our overview of parameter exploration with COPASI. Note that this only brushes up the topic and I hope I picked your curiosity enough for you to read more about it.
Do you have a model that you want to improve? Do you need to model a biological system but do not know the best method or software tool to use? Drop me a message and I will be happy to have a chat.
Il faut toujours mettre l’adjectif au plus près du nom qu’il qualifie. Cela semble évident, n’est-ce pas ? Et pourtant, ce n’est pas un réflexe, surtout dans les textes techniques qui ont tendance à utiliser une syntaxe anglo-saxone. Pourtant, la position de l’adjectif n’est pas neutre, et est au contraire essentielle pour la bonne compréhension du texte et son utilisation ultérieure.
Prenons l’exemple d’un test de grossesse se basant sur la mesure de l’hormone de croissance dans les urines. Faut-il écrire un « test urinaire de grossesse » ou bien un « test de grossesse urinaire » ? Le premier bien sûr, car c’est le test qui est urinaire, pas la grossesse. Au pluriel, il n’y a pas de problème. Dans « tests de grossesse urinaires » les S nous révèlent le lien entre le test et la substance testée. La situation est plus complexe au singulier. Un être humain n’aura bien entendu aucun mal à comprendre qu’une grossesse ne peut être urinaire (du moins on l’espère). En revanche, les systèmes d’analyse lexicale automatique (et un peu simplets, il faut bien le reconnaître) découperont l’expression en
[ TEST ] [ DE ] [ [ GROSSESSE ] [ URINAIRE ] ]
En revanche, un « test de grossesse extra-utérine » teste la localisation extra-utérine (ectopique) de la grossesse. Ici, la grossesse est extra-utérine, pas le test.
Tout cela paraît bien logique. Qu’en est-il en réalité ? Malheureusement, notre ami Google retourne 7970 réponses pour l’infortuné « test de grossesse urinaire » contre seulement 3310 réponses pour « test urinaire de grossesse » (encore que Google Trends donne la première forme gagnante sur le long terme). Le domaine académique fait un peu mieux, Google Scholar retournant 77 entrées pour « test urinaire de grossesse » contre 71 pour « test de grossesse urinaire » Mais il y a pire puisqu’on retrouve cette dernière forme dans des textes de référence comme LE Vidal, voire même des documents de la Haute Autorité de Santé.
Voyons maintenant un exemple plus compliqué, le « rapport normalisé international », traduction de l’anglais « international normalized ratio ». Est-ce vraiment « rapport normalisé international » pour qui Google nous donne 6610 réponses et Google Scholar 99 entrées, ou bien « rapport international normalisé » pour qui Google nous donne 15300 réponses et Google Scholar 234 entrées ? C’est le premier. Cette variable mesure le rapport entre le temps de coagulation chez un patient (le « temps de Quick ») et sa valeur chez un témoin. C’est en cela qu’elle est « normalisée ». Cette mesure étant reconnue internationalement, c’est le « rapport normalisé international ».
Pourquoi la situation est-elle plus compliquée qu’avec le test urinaire de grossesse ? Le mot clé est « normalisé ». Alors que la version anglaise n’est pas ambiguë, elle l’est en français, où l’adjectif « normalisé » est la traduction à la fois de « normalized », c’est-dire une valeur ramenée à l’échelle, et de « standardized », c’est-dire une valeur reconnue officiellement comme une norme. Dès lors, le « rapport international normalisé » pourrait avoir une toute autre signification, qui serait la version « standard » du « rapport international ». Je ne serais du reste pas surpris qu’une grande partie des positionnements malheureux trouvent leur origine dans cette confusion.
En conclusion, toujours placer l’adjectif au plus près du nom ou de l’expression qu’il qualifie. Et si vous traduisez un texte de l’anglais au français, n’hésitez pas à modifier l’ordre d’un enchaînement d’adjectifs en passant d’une langue à l’autre. Enfin, si vous avez le moindre doute, recherchez la signification de l’expression.
When it comes to clinical trials and pharmacovigilance, using the right word is crucial for an accurate and precise shared understanding. Unfortunately, this is not always the case, even in documents written by specialists. While this can sometimes lead to a certain degree of vagueness in communication within a given language, the situation becomes worse when it comes to documents that need a translation. Especially as the use of given terms may be subject to hyponyms/hyperonyms relationships that differ according to language and context.
In this post, we will look at some terms that generate endless debate in professional forums, all related to safety efficacy data associated with treatments, namely: tolerability, tolerance, safety, innocuousness, and their French equivalents, tolerability, tolerance, safety and innocuousness.
Tolerance and tolerability
Tolerancetotreatment is the word used in pharmacology and clinical trials to designate habituation, i.e. the fact that the same intensity of treatment leads to increasingly weaker effects (note that in the field of drug of abuse, the terms tolerance and addiction carry sometimes a subtle difference: Tolerance is the fact that a given dose leads to an increasingly weaker effect, whereas addiction means that higher and higher doses are needed to obtain a given effect). The French translation of tolerance is tolérance.
Tolerabilitycharacterises the subject’s ability to withstand adverse effects. While tolerance refers to efficacy data, tolerability refers to safety data. It is a precise term from clinical trials and is not found in any standard dictionary. The French translation of tolerability is tolérabilité. Let’s be honest, these terms are atrocious. However, when it comes to patient safety, the literary elegance and aesthetics of the word are less important than precision and accuracy. “Tolérabilité” is often criticized as “anglicism”, with critics encouraging the use of tolerance to translate tolerability (following in that many French dictionaries). This is forgetting that, in addition to being false, tolerability is itself originally an Anglicism. Perhaps one way to clarify things is to look at adjectives. A person is tolerant to a drug, while a drug is tolerable for a person.
Safety and
innocuousness
We are now entering a turbulent zone where tempers flare and linguists grapple with each other. Most of the time, because they are not versed in the handling of ontologies and hyponym/hyperonym relationships. Do safety and innocuousness refer to different concepts? Yes. Do the concepts of safety and innocuousness overlap? Yes. Do safety and innocuousness always translate into the same French terms? No.
Let’s start with innocuousness. The innocuousness of a drug is its ability to work without causing adverse effects (harmlessness). A drug that is innocuous is a safe drug. The term is rarely used in practice, see below. The French translation of innocuousness is innocuité. It should be noted that innocuousness and tolerability are not synonyms. A drug may have a bad innocuousness but good tolerability. For example, it could cause side effects in most cases, these effects being well tolerated.
Where things get complicated is when we approach the notion of safety. The French translation of safety is sécurité. Depending on the context, the concept of safety covers a more or less broad semantic landscape. We will translate the expression “safety and tolerability” by “innocuité et tolérabilbilité“. However, in the expression “safety and efficacy”, safety covers both innocuousness and tolerability. Therefore, we will translate the expression into “sécuritéet efficacité“. Note that “safety” is never translated into “sureté”, although “safe” is translated into “sûr”.
Finally, let us agree that while the greatest precision is necessary between health professionals, it must not lead to pedantry that hinders clear and elegant communication with the patient. We will therefore translate our “commitment to ensuring your safety” into our “engagement à garantir votre bien-être” and not “garantir votre sécurité “. Unless the practitioner is also a bodyguard.
Dans les domaines des essais cliniques et de la pharmacovigilance, l’utilisation du mot juste est cruciale pour une compréhension partagée précise et exacte. Ce n’est malheureusement pas toujours le cas, même dans les documents écrits par des spécialistes. Si cela peut parfois engendrer un certain flou dans les communications au sein d’une langue donnée, la situation devient pire lorsqu’il s’agit de documents à traduire. D’autant que l’usage de vocables donnés peut obéir à des relations hyponymes/hyperonymes différant selon la langue et le contexte.
Dans ce billet, nous allons nous pencher sur un certain nombre de termes qui engendrent débats sans fin sur les forums professionnels, tous en rapport avec les données d’efficacité de sécurité associés aux traitements, à savoir : tolérabilité, tolérance, sécurité et innocuité et leurs équivalents anglais tolerability, tolerance, safety, innocuousness.
Tolérance et tolérabilité
La tolérance a un traitement est le mot venant de l’anglais utilisé en pharmacologie et dans les essais cliniques pour désigner l’accoutumance, c’est-dire le fait qu’une même intensité de traitement entraîne des effets de plus en plus faibles (à noter que dans le domaine de la recherche sur les drogues, les termes tolérance et accoutumance s’accompagnent parfois d’une différence subtile : La tolérance est le fait qu’une dose donnée entraîne un effet de plus en plus faible, alors que l’accoutumance signifie qu’il faut des doses toujours plus fortes pour obtenir un effet donné). La traduction anglaise de tolérance est tolerance.
La tolérabilité caractérise la capacité du sujet à supporter les effets indésirables. Alors que la tolérance se rapporte aux données d’efficacité, la tolérabilité se rapporte aux données de sécurité. C’est un terme très spécifique des essais cliniques, et qu’on ne trouve dans aucun dictionnaire usuel. La traduction anglaise de tolérabilité est tolerability. Soyons honnêtes, ces termes sont atroces. Mais quand il s’agit de la sécurité du patient, l’élégance littéraire et l’esthétique du mot sont moins importantes que la précision et l’exactitude. « Tolérabilité » est souvent critiqué comme étant un « anglicisme », les critiques encourageant l’usage de tolérance pour traduire tolerability (suivant en cela de nombreux dictionnaires français). C’est oublier qu’en sus d’être faux, tolérance est lui-même un anglicisme à l’origine. Une façon de clarifier les choses est peut-être de regarder les adjectifs. Une personne est tolérante à un médicament, alors qu’un médicament est tolérable pour une personne.
Sécurité et innocuité
Nous entrons maintenant dans une zone de turbulences où les esprits chauffes et les linguistes s’écharpent. La plupart du temps parce qu’ils ne sont pas versés dans le maniement des ontologies et des relations hyponymes/hyperonymes. Est-ce que sécurité et innocuité désignent des concepts différents ? Oui. Est-ce que les concepts de sécurité et innocuité se recouvrent ? Oui. Est-ce que sécurité et innocuité se traduisent toujours par les mêmes termes anglais ? Non.
Commençons par l’innocuité. L’innocuité d’un médicament est sa capacité à agir sans entraîner d’effets indésirables. Un médicament ayant une bonne innocuité est un médicament sûr (innocuous en anglais). La traduction anglaise d’innocuité est innocuousness(ou innocuity, ou même harmlessness), ces vocables étant très peu employé en clinique, voir plus bas. Jusque-là, pas de problème, même si ça suffit à faire sortir de leurs gonds maints traducteurs voulant réserver le terme innocuité au français canadien. À noter que l’innocuité et la tolérabilité ne sont pas synonymes. Un médicament peut avoir une mauvaise innocuité mais une bonne tolérabilité. Par exemple, il peut entraîner des effets secondaires dans la plupart des cas, mais que ces effets soient bien tolérés.
Là où les choses se compliquent, est lorsque l’on aborde la notion de sécurité. La traduction anglaise de sécurité est safety. Selon le contexte, le concept de safety couvre un paysage sémantique plus ou moins large. Nous traduirons l’expression « safety and tolerability » par « innocuité et tolérabilité ». En revanche, dans l’expression « safety and efficacy », safety couvre à la fois l’innocuité et la tolérabilité. Nous traduirons donc l’expression en « sécurité et efficacité ». À noter que « safety »n’est jamais traduit en « sureté », bien que « safe » soit traduit en « sûr ».
Pour finir, convenons que si la plus grande précision est nécessaire entre professionnels de la santé, elle ne doit pas entraîner un pédantisme entravant une communication claire et élégante avec le patient. Nous traduirons donc notre « commitment to ensure your safety » en notre « engagement à garantir votre bien-être » et non à « garantir votre sécurité ». Ce à moins que le praticien soit également un garde du corps.
Le monde est aux prises avec l’une des pandémies les plus graves qu’il ait dû affronter dans les temps modernes. La cause en est l’infection par un coronavirus, le SARS-CoV-2. Chez une partie des êtres humains infectés, ce virus entraîne l’apparition de signes et de symptômes, qui forment — comme la cause première en est identifiée — une maladie, appelée covid-19, pour « maladie à coronavirus 2019 ». Cette maladie peut se présenter de manière plus ou moins sévère, parfois demander une hospitalisation et dans un certain nombre de cas être létale.
Pourquoi covid-19 est-il féminin ?
La covid-19 est une maladie ; c’est le sens du « d » à la fin du nom, signifiant « disease » en anglais. Dans la terminologie médicale, une maladie est un ensemble de signes cliniques et de symptômes liés à une ou des causes identifiées ; ce qui la distingue des syndromes (signes et symptômes sans cause nécessairement identifiées ou existantes) et des affections (altération des fonctions d’un organe indépendamment des causes).
En français, les maladies infectieuses sont généralement du genre féminin. En ce qui concerne les maladies causées par des virus, on écrit par exemple la rougeole, la variole, la grippe, la varicelle et j’en passe. Dans les maladies causées par des bactéries, on trouve la tuberculose, la peste, la syphillis, etc. Les exceptions viennent souvent d’appellations antérieures à l’identification des causes comme le tétanos, décrivant le symptôme — le tétanus du muscle —, le paludisme, venant de l’origine de l’infection — le marais —, ou bien encore le sida, qui était à l’origine un syndrome.
L’Organisation mondiale de la santé, qui a créé le nom, l’a utilisé au féminin en français dès le 11 février 2020. À l’époque, le grand public et la presse ne parlait que du virus, de « l’épidémie du coronavirus ». Cette forme féminine est largement utilisée au Canada et devient vite officialisée par l’Office québécois de la langue française. En Europe, les différentes instances ne différencient pas le virus de la maladie et utilisent initialement le masculin. Il faut attendre mai 2020 pour que l’Académie française exprime sa préférence pour le féminin.
Pourquoi est-ce important ?
La bataille des lexicographes sur le genre d’une maladie est certe intéressante et utile. Bien que tout langue soit « vivante » et qu’elle évolue au cours du temps, l’existence d’un ensemble de règles de base permet une communication fluide entre ses utilisateurs. Tout parent — et tout enseignant ! — corrigerait un enfant qui écrirait « le grippe » ou « le rougeole ». Cependant le genre de covid-19 présente une importance particulière.
La confusion entre l’infection par SARS-CoV-2 et l’atteinte de covid-19 est très largement répandue. Une grande partie de la population est persuadée qu’être infecté par le virus signifie être malade. Récemment le pilote de Formule 1 Sergio Perez a été testé positif pour le SARS-CoV-2. Il a immédiatement été inondé par les messages de soutien sur les réseaux sociaux, se désolant de sa maladie et lui souhaitant un prompt rétablissement. Rien n’indique cependant que Sergio Perez ait présenté un quelconque signe clinique ou se soit plaint de symptômes liés à la maladie. Cette confusion est entretenue, volontairement ou non, par les pouvoirs publics de très nombreux pays qui communiquent le nombre de tests positifs mais non le nombre de malades (si l’on était cynique, on remarquerait aussi que la mortalité dans de nombreux pays reste extrêmement faible car seules les personnes ayant été testées positives sont comptées dans les statistiques. Les personnes dont le certificat de décès indique covid-19 comme cause identifiée ou probable mais qui n’ont pas été testées sont le plus souvent ignorées).
La proportion importante de personnes infectées mais ne présentant pas de signes ou symptômes, dites asymptomatiques, est une chance et une malédiction. Une chance, car l’infection est au final peu dangereuse, en particulier pour les personnes ne présentant pas de co-morbidités spécifiques, comme l’obésité ou un grand âge (peu dangereuse au niveau individuel s’entend. La situation est bien entendu différente au niveau de la société toute entière). C’est une malédiction car en l’absence de tests systématiques, répétés et à large échelle, la plupart des personnes infectées ne sont pas détectées et continuent donc à propager le virus.
Cette confusion au sein du grand public affecte sans nul doute les décisions politiques et de santé publique (du reste, les politiques font également partie du « grand public » quand il s’agit du domaine médical). Par exemple, les énergies et les finances doivent être partagées de manière intelligente entre la lutte contre la propagation du virus et la préparation des systèmes de santé.
Que dois-je écrire ?
Le plus important est de différencier entre l’infection et la maladie. Paradoxalement, les usages en cours au début de la pandémie était meilleurs, puisqu’ils parlaient « du coronavirus », signifiant par là SARS-CoV-2 (il existe de nombreux coronavirus). On préférera donc :
Il/elle est contaminé/e par le coronavirus.
L’infection par le coronavirus est importante dans cette ville.
La propagation du coronavirus ne ralentit pas.
Mais :
Il/elle présente les symptômes de la covid-19.
La covid-19 a été une des principales causes de surmortalité chez les personnes âgées en mars 2020.
On pourra cependant omettre l’article dans certains cas, en suivant l’usage pour d’autre maladies, comme la varicelle :
Il est atteint de covid-19.
Une toux incessante est un symptôme de covid-19 (mais probablement « un des symptômes de la covid-19 »…)
En
aucun cas :
Il/elle présente les symptômes du covid-19
Le covid-19 accroît le fardeau du personnel de santé.
Pour
finir, notez que ce billet ne fait pas l’honneur d’une majuscule
à cette maladie. La dénomination covid-19 n’est pas un nom
propre, et malgré son impact, direct ou indirect, elle ne mérite
pas de pré-éminence sur les autres maladies virales circulant
autour du globe comme la grippe, l’hépatite et le sida.
Covid-19 affects all of us on a daily basis and discussions about the disease stir passions, whether among politicians, health professionals, scientists, or the general public. Commentary and debate, particularly about the seriousness of the pandemic and how to counter it, are often tainted by inaccuracy and even bad faith due to confusion between different concepts and misunderstanding of some of them. People talk about different things, compare things that are not comparable, and misrepresent what others are saying.
I’m not a doctor or an epidemiologist. My opinions are my own, and I am certainly not in a position to provide advice. This post is not intended to take a position, but to provide some clarity on concepts that have been thrown around in pieces of news and in raging tweets.
Are Covid-19 and SARS-CoV-2 the same thing?
No, Covid-19 and SARS-CoV-2 are not two names for the same thing. Covid-19 is a “disease“, which is a set of symptoms related to an identified common cause (as opposed to a “syndrome“, which is a set of symptoms with an unknown, uncertain, or irrelevant cause). This disease is due to the infection of humans with the SARS-CoV-2 virus. This infection is the cause of the disease, not the disease itself. A large part of the population shows no symptoms after SARS-Cov-2 infection, people are said to be “asymptomatic”. In other words, these people are not sick. According to studies, this population is estimated to be between one-third of those infected to several times the number of people having the disease.
So we can see that there is a big difference in seriousness depending on whether we’re talking about the virus infection or the disease. SARS-CoV-2 infection is generally not very serious compared, for example, to Ebola or rabies viral infections. On the other hand, because of the severe respiratory symptoms and the lack of treatment, Covid-19 disease is actually more dangerous than rabies.
The disease is diagnosed on the basis of symptoms, before hospitalization, during hospitalization, or post-mortem. Only a certain proportion of patients are tested for the presence of the virus. It is generally accepted that for all patients with symptoms of Covid-19 and positive for the virus, the virus is the triggering factor for the disease. But it must be remembered that we are all permanently infected with several viruses (sometimes several strains of the same virus). For patients who are not tested for the presence of the virus, the decision depends on local policies. Hence, for example, the debates on the very low mortality from Covid-19 in Russia, or the real extent of deaths in care homes.
To summarise, not all persons infected with SARS-CoV-2 are sick with Covid-19, and it is possible that in a small proportion of persons diagnosed as sick with Covid-19 (especially in post-mortem diagnoses) the disease was in fact not triggered by SARS-CoV-2.
Above, I used the word “mortality”. So it’s time for a little vocabulary check.
Mortality, Lethality, Case Fatality Rate, Infection Fatality Rate
The “mortality” of a disease is the number of people killed by that disease in a given population, including those without the disease. The “lethality” of a disease is the number of people killed by the disease in patients with the disease. The lethality of a disease does not depend on its “prevalence“, while this is the case with mortality. In most countries, seasonal flu has a much higher mortality rate than Ebola hemorrhagic fever, although the latter has a much higher case fatality rate.
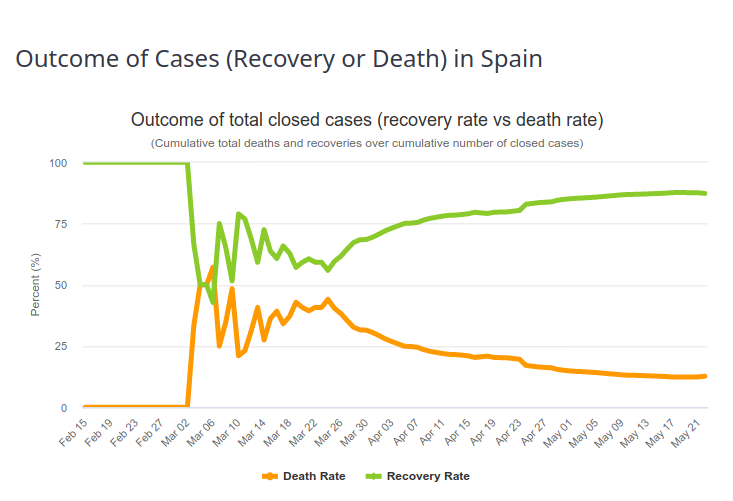
In order to estimate the fatality rate of a given infectious disease, the observed values of deaths in the sick population must be matched. The observed value is the Case Fatality Ratio (CFR). The estimated value is the Infection Fatality Ratio (IFR). One would think that with a well-constructed and careful assessment these numbers are close. They are not. The first reason is described in the previous paragraph (the difference between infection detection and disease diagnosis). The second is that the case-fatality rate changes over time. The first patients diagnosed usually have severe forms, with high mortality. The observed case-fatality rate is therefore very high (an extreme case being 100% if the first patient dies). As the diagnosis is extended to a larger population, and as the management of patients improves, the proportion of people surviving the disease increases. And the case-fatality rate tends to the infection fatality rate i.e., the “true” case fatality rate. This evolution can be seen in the image below, representing the outcome of Covid-19 diseases in Spain (Source https://www.worldometers.info/coronavirus/country/spain/, 23 May 2020). The first patient recovered, and then for a period of time 50% of the patients died, which corresponds approximately to the fraction of deaths of Covid-19 patients on ventilators. Then, the recovery rate increases more or less steadily.
It is very important to understand that if 10% of the patients diagnosed with Covid-19 in a given area and at a given time die from the disease, it absolutely does not mean that 10% of the people infected with the virus will die from it.
Can lethality be compared between countries? Influence of testing policies
In order to assess infection-fatality rates, it is, of course, necessary to measure case fatality rates and to be able to detect cases. There are two types of tests.
So-called serological tests detect the presence of antibodies in the blood that target the virus. These tests can tell if a person has been infected in the past. There are two main problems with these tests. First, at the moment we do not know exactly what proportion of infected people create antibodies. In the case of infected people who have developed Covid-19, it seems that the amount of antibodies is related to the severity of symptoms (probably because symptoms are related to the amount of virus, the “viral load“). The big unknown is for people who have not developed the disease. Second, these tests are generally not very reliable, and in particular, their “sensitivity” is not high enough (more details in this post).
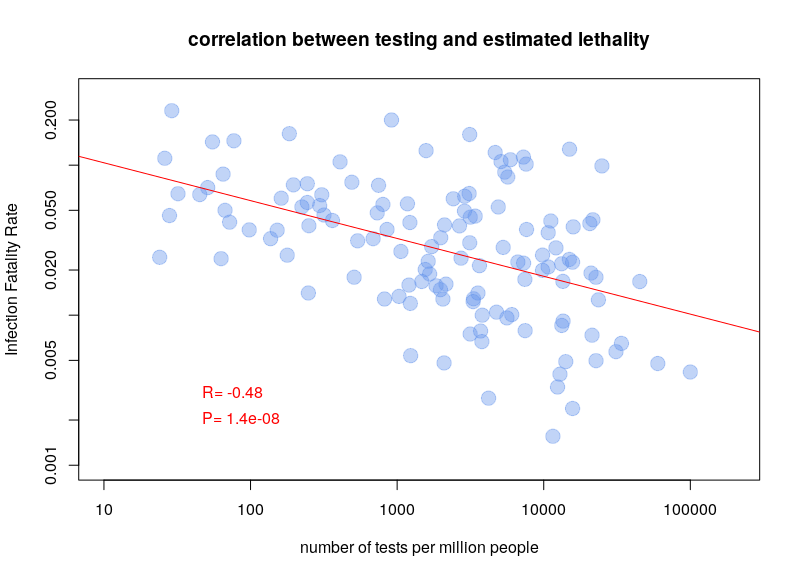
The other type of test detects the presence of the virus in actively infected people. The problem with these tests is that they have to be repeated over and over again. For a few days after infection, the viral load is not sufficient to be detected. Also, after a few weeks, the virus is no longer detectable. A person who had symptoms of Covid-19 can now be negative. Nevertheless, this is the type of test used to calculate case fatality rates. It is therefore clear that the testing policy will influence the calculations. If a country only tests people entering the hospital, the case fatality rate will be higher than if a country tests the whole population. It is therefore not surprising that there is a very clear correlation between case-fatality rates and the number of tests performed per million inhabitants. The graph below is based on Worldometer data from 10 April 2020.
Can lethality be compared between countries? Influence of age structure
Different studies have attempted to calculate an overall lethality rate of Covid-19 for the whole population, see for example here, here, and here. These estimates are based on data obtained by different methods (e.g. disease diagnosis, virus detection, detection of antibodies to the virus) in disparate regions, and analysed in a variety of ways. Not surprisingly, the results are, to say the least, heterogeneous. What they have in common is the desire to determine a “universal” rate. Trying to determine a single lethality for a disease is a justifiable exercise. However, this rate can only be valid for a homogeneous population and will necessarily vary between populations, making comparisons difficult, if not irrelevant.
The first factor is the effect of age. Most respiratory diseases disproportionately affect the elderly. As a result, infections with the viruses that trigger these diseases, such as influenza, show highly age-dependent mortality. Similarly, an estimate of the lethality rate of Covid-19 in China was 0.0016% for children aged 0-9 years and gradually increased to 7.8% for those over 80 years of age, an increase of almost 5,000 times.
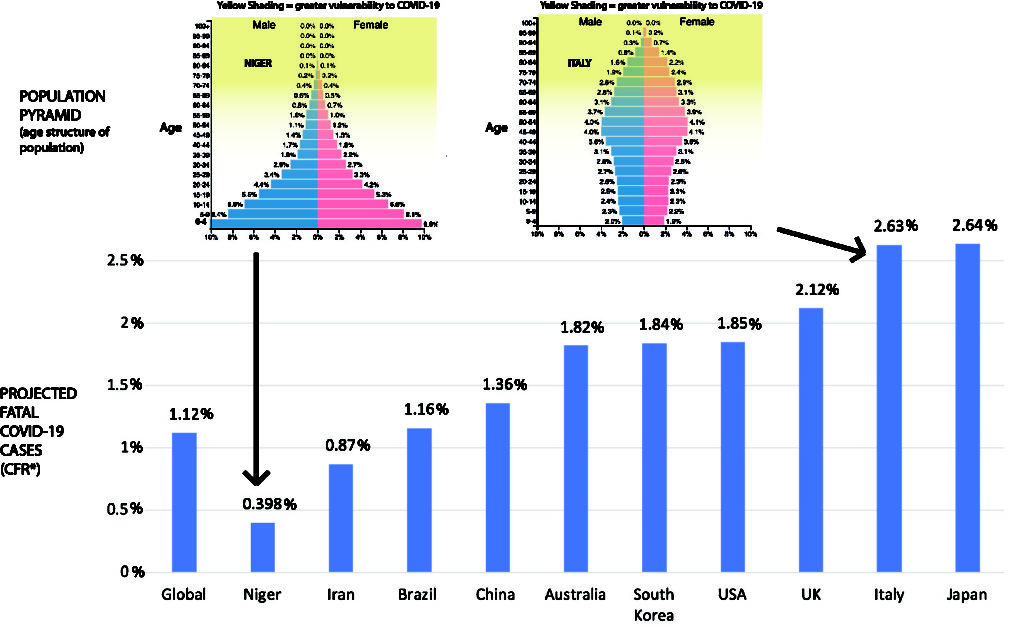
If lethality depends on age, so does mortality. However, the relationship is not direct because of the distribution of the population by age group (the population pyramid). There are many more people aged 60 to 85 than there are aged 85 to 110. Although Covid-19 is much more lethal in the latter population, there are more deaths in the former. Since different countries have different age pyramids, this will affect their overall estimated lethality, as shown in the figure below (borrowed from https://theconversation.com/the-coronavirus-looks-less-deadly-than-first-reported-but-its-definitely-not-just-a-flu-133526)
However, beware, things are not that simple. As the UN showed as early as 1955, the global mortality curve is affected by life expectancy. Mortality at age 25 in a country with a life expectancy of 60 is similar to mortality at age 45 in a country with a life expectancy of 70. This is due to the underlying causes of lower life expectancy. Which brings us to the comorbidities.
Can lethality be compared between countries? Influence of comorbidities
Stricto-sensu, comorbidities are the other disorders that will affect the outcome of the disease. However, for this post, I mean all the factors not related to SARS-CoV-2 infection that will affect the lethality of Covid-19. One research paper studied many of these factors in a large cohort of over 96,000 patients from six continents (the purpose of the study was to study the effect of drugs on Covid-19, but that is not our point here). If each year of life increases the risk of Covid-19 death by 1%, one BMI point increases it by 6%, having diabetes by 20%, smoking by 27% and being Hispanic by 50%! These different factors are of course not independent (and therefore not additive).
The impact of ethnicity may come in part from genetic predisposing factors, as well as environmental conditions. For example, it is clear that the transmission of SARS-CoV-2 is affected by temperature and humidity as well as air pollution. It is not impossible that the outcome of the disease may also be affected (possibly via respiratory co-morbidities).
Finally, the state of health systems has a considerable impact on the number of Covid-19 deaths. While most patients have only mild symptoms (let alone asymptomatic people), a fraction of patients requires respiratory assistance. In the worst case, these people need to be intubated. A large fraction of these people survive. In health care systems with insufficient ventilator capacity, all of these patients die. This is regardless of the policies undertaken to contain or eradicate the disease. However, these policies are important to keep the number of patients with severe Covid-19 below the limits of the health care system (“flattening the curve”).
Herd immunity collective or lockdown policies
One of the inexhaustible sources of sterile and acrimonious debate is the battle between advocates of “herd immunity” and those of “isolation”. The latter notion is familiar to everyone and fairly simple to understand. If people are isolated, through social distancing and confinement, they cannot be contaminated or contaminate others. Moreover, if we quarantine the sick long enough for them to recover and get rid of the virus, we can eradicate it. Obviously, in the case of SARS-CoV-2, the goal is no longer to eradicate it, as the number of infected people is too large and their geographical distribution too wide. The aim is to reduce the number of severe diseases as much as possible while waiting for a vaccine.
Herd immunity means that a sufficient portion of the population is exposed to the virus and develops an immune response so that the chance of an unexposed person encountering an infected person is very low. For many viruses, the required proportion of the population is just over 80%. Note that this principle of herd immunity is a key aspect of vaccination campaigns. In order for a campaign to keep disease at bay, a certain portion of the population must be vaccinated. Building up such herd immunity also goes hand in hand with isolating vulnerable people until the required % of immunized people are reached (no one suggests, as is sometimes written, that the herd immunity strategy means sacrificing a % of the population corresponding to the IFR, i.e. almost 1% of the world’s population).
Estimates of the % of the population that has developed immunity to SARS-CoV-2 infection vary between 1% and 25% depending on the study. A cohort study in Geneva observed a growth rate of 3% per week. This percentage is obviously far from sufficient for a society to rely on herd immunity. Does this mean that the idea of herd immunity is invalidated? Not at all. At best, it reflects the success of isolation policies. In the long term, the consequences of isolation policies might outweigh the consequences of SARS-CoV-2 infection, especially if effective vaccination or treatments, whether curative or prophylactic, are not forthcoming.
The important thing is that the two approaches are incompatible and therefore the consequences of the application of one cannot be used to judge the other. Moreover, between absolute quarantine and uncontrolled exposure, there is a continuum of possibility. For example, an interesting approach, based on the fact that Covid-19 is mainly severe in elderly subjects or those with co-morbidities, is the concept controlled avalanche based on voluntary infections.
Of course, this post only deals with some of the concepts underpinning the heated debates about Covid-19. However, I hope you will use it as a starting point to explore the diversity of opinions available and avoid the pitfall of snap judgements. Everyone is in the same boat and is looking for the same thing: a resolution to this crisis with the fewest possible casualties and consequences.